A Systemwide Approach to Managing the Risks of Continuous Manufacturing

Understanding and managing risks to continuous manufacturing (CM) technology is central to any decision to greenlight CM in a production-ready environment. Applying a systemwide risk management (SRM) approach to manufacturing is essential to ensuring manufacturing projects are vetted in a comprehensive and consistent manner.
Advanced technologies such as CM have the potential to greatly transform pharmaceutical production processes by improving drug quality and supply continuity for consumers worldwide while benefiting the company’s bottom line. For much of the pharmaceutical industry, batch manufacturing (BM) processes that have been relied upon for decades remain the preferred approach for most oral solid dosage (OSD) drug products. Considerable uncertainty exists, however, among manufacturers regarding the costs and benefits of CM technology, including several risks that, so far, are holding companies back from making the leap to CM.
Understanding and managing these risks is central to any decision to greenlight CM in a production-ready environment. Although much focus by industry and regulatory authorities remains on manufacturing quality, and rightly so, a host of other major risks must be managed, including financial, investment, operational, environmental, regulatory, supply chain, legal, and strategic risks. These risks tend to be managed separately, but in most cases, are integrated. Applying an SRM approach to manufacturing is essential to ensuring manufacturing projects are vetted in a comprehensive and consistent manner.
Although guidance such as ICH Q9 on quality risk management (QRM) provides a roadmap for the framework and activities to be employed in managing manufacturing quality, these principles need to be broadened and applied across the spectrum of risks that collectively can adversely affect existing manufacturing activities as well as new manufacturing projects. For example, significant cost uncertainty surrounds the use of CM over BM processes, and though this is technically not a manufacturing quality issue, it directly factors into whether to invest in CM or not.
That outcome can affect manufacturing quality if, as a considerable body of research suggests, CM improves quality and operational efficiency while lowering manufacturing downtimes, product defect rates, and scrap costs. Financial risk, therefore, must be incorporated into the calculus of CM investment decisions, along with other risks not directly tied to quality management. This is where an SRM capability is required.
Leveraging SRM Concepts for CM
SRM provides a formalized structure about the way in which a company manages its various risks. That structure allows for a consistent approach to identify, measure, report, and mitigate risks, not only for a business line or manufacturing site, but evenly across other activities of a company, such as clinical trial processes. It is conducted at both the macro (enterprise) and the micro level (business unit and even product) and relies on both qualitative and quantitative assessments of risk to the organization. For years, depository institutions such as commercial banks, operating in a highly regulated environment like the pharmaceutical industry, have been held to a high standard in managing risk at an enterprise level.1
During the 2008 financial crisis, many firms became insolvent due in part to poor loan manufacturing processes used to originate subprime mortgages that amplified credit risk. The techniques and practices adopted by these companies, referred to as enterprise risk management (ERM), can easily be adapted for assessing pharmaceutical manufacturing risk. NASA, for example, leverages many of these concepts in their risk-informed decision-making process (RIDM) for spaceflight programs.2
- 1US Treasury, Office of the Comptroller of the Currency. “OCC Guidelines Establishing Heightened Standards for Certain Large Insured National Banks, Insured Federal Savings Associations, and Insured Federal Branches; Integration of Regulations.” Final Rule. 12 CFR Parts 30, 168, and 170. Federal Register 79, no. 176 (September 2014):54517–49.
- 2NASA. NASA Risk Management Handbook NASA/SP-2011-3422, Version 1.0. Washington, D.C.: NASA Headquarters, 2011. https://ntrs.nasa.gov/api/citations/20120000033/downloads/20120000033.pdf
The SRM risk assessment process is only as strong as the underlying risk culture and governance practices of the company. In the banking sector, roles and responsibilities are well-specified in the form of the three lines of defense (3LoD) doctrine. The business area represents the first line of defense and by virtue of its role in managing the profitability and performance of their business is accountable in the first instance for managing its risk.
The second line of defense is represented by a corporate risk function that oversees and provides overarching guidance about risk management for the firm. The company’s internal audit function, representing the third line of defense, ensures that the practices and controls implemented by the other two lines of defense are valid and appropriate. In the context of a CM project, the business unit would be responsible for conducting the manufacturing risk assessment for CM project feasibility with review and verification by the corporate risk second line team.
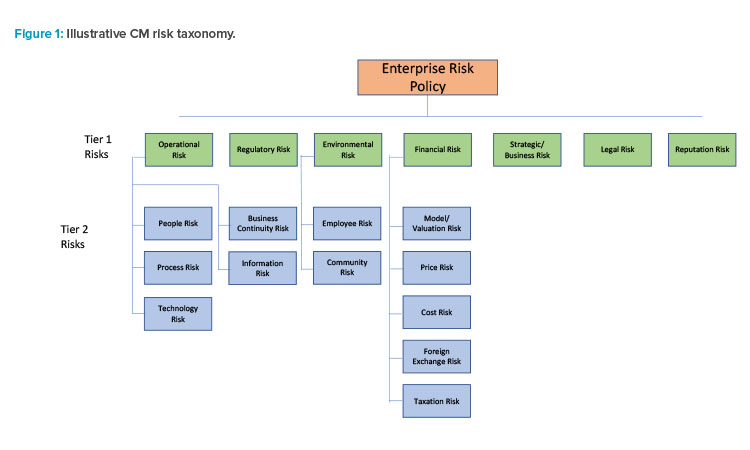
One of the most important components of SRM is the company’s risk appetite statement. This document is approved by the firm’s board of directors and sets the tone for risk-taking at the company by key risks and setting risk tolerances for how much risk the board is willing to take across all business activities. For pharmaceutical manufacturing, ensuring drug products meet or exceed “safe and effective” standards of quality is a prerequisite. Beyond that standard, risks encountered in the manufacturing process should have a risk appetite statement associated with it commensurate with the risk tolerance of the board. A companion to the risk appetite statement is the risk taxonomy. This document catalogs and summarizes the various risks to the company. A list of key risks associated with CM that would require a risk assessment is shown in Figure 1.
Risks can be differentiated between primary (Tier 1) and secondary (Tier 2) risks. One of the greatest risks pharmaceutical manufacturing faces is operational risk, which can lead to reductions in profitability and higher costs, and impose other risks on firms. Operational risk is associated with deficiencies in process, people, or technology or external events that have adverse financial and nonfinancial consequences for the organization.
In the case of pharmaceutical manufacturing, operational risk can manifest in the form of underlying process weaknesses (e.g., deficiencies in standard operating procedures) that lead to product contamination, higher scrap rates, greater risk of environmental hazards and employee safety risk, manufacturing downtimes, and longer processing periods than desired. These outcomes, in turn, raise the firm’s costs and/or expose it to potential regulatory scrutiny as well, which brings its own set of risks. Companies that can objectively compare BM vs. CM processes considering these factors are in a better position to understand how manufacturing quality can lead to improved financial and nonfinancial outcomes.
Operational risk is usually a catalyst for other primary risks. Risks tend to cascade once an event has unfolded as happened to banks with poor loan manufacturing processes. Operational risk was a catalyst leading to a credit and liquidity risk crisis at many banks in 2008, eventually posing enormous regulatory, legal, and reputation risk to those firms with poor operational controls. The same is true for pharmaceutical manufacturing where a drug recall today due to any number of operational factors can become tomorrow’s headline and regulatory risks.
For example, a recall in 2008 of the widely used blood thinning drug heparin occurred due to an adulteration of the manufacturing process that introduced oversulfated chondroitin sulfate (OSCS) into batches of the product from a manufacturing facility in China. It led to many severe reactions to heparin in the U.S. and some deaths. Although an isolated event, considering the vast numbers of OSD products manufactured each year, the heparin recall stands out as a cautionary tale for the importance of quality in pharmaceutical production and operational risk management capabilities.
The risk appetite statement should in turn be driven to each line of business with key risk indicators (KRIs) developed for important risks to be managed for that year. Ideally, those risks should be quantified in some fashion and used in setting employee incentive compensation plans. At the business unit level, the risk appetite approach could be leveraged in product development and new initiatives such as manufacturing technology investments. A formal risk assessment process should be integrated into the CM evaluation process.
Developing a Robust Risk Assessment Process for CM Technology
Adoption of CM technology in pharmaceutical manufacturing has elements of both risk and uncertainty. Distinguishing between them is critical to how companies approach risk management. According to Knight, risk management is not knowing the outcome from an action in advance; rather it’s having the ability to reasonably measure its likelihood. More formally, there are both a priori and statistical probabilities that provide a means of assessing risk.3
An example of an a priori probability is the mathematical representation of a distribution of product defect rates over a period. Some aspects of pharmaceutical manufacturing processes and QRM controls and assessment lend themselves to quantifiable measurement of risks, such as operational failures and/or quality defects, based on actual manufacturing data with existing technology. However, limited experience and data associated with CM in the pharmaceutical industry in general presents several challenges in measuring key risks in this manner for which another approach to risk assessment is required. This is exactly where a robust SRM process can guide the CM evaluation process.
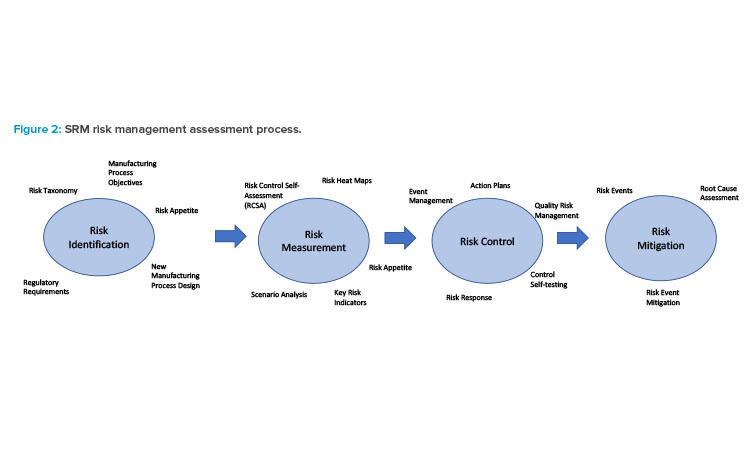
The general SRM framework is depicted in Figure 2. A sequence of four major risk activities comprise the risk assessment process. It starts with identifying all the risks associated with a CM initiative. Determining the specific objectives of the project (e.g., establishing a new facility for new products, expanding manufacturing capability of existing products, or replacing an existing batch process for current products) along with mapping out the new CM process from end to end, is required to highlight any potential risks associated with the new technology.
Developing a catalog of all risks associated with the CM process, as illustrated in Figure 1, is essential during this phase to ensure each risk lies within the firm’s risk appetite. The process is dynamic with a built-in feedback mechanism. Should issues or events arise over time, a root cause analysis (RCA) would be used to identify what happened and provide recommendations on mitigating such occurrences in the future.
A precursor to measuring any risk associated with CM is the development of a risk profile. Any new process such as CM invariably exposes the company to inherent risk, which is defined as the uncontrolled risk of some form associated with the new process. An example of an inherent CM risk would be the lack of staff that has experience operating the CM process, which could lead to delays in production schedules. The inherent risk for each risk type identified in the CM risk taxonomy would need to be evaluated.
Once inherent risks are identified and evaluated, controls to ensure each risk remains within the firm’s risk appetite would be developed. An example of a control to mitigate the inherent risk of supply shortages of skilled CM operators might be the introduction of a formal CM training program for all manufacturing operators. A final assessment of post-control risk, referred to as residual risk, accompanies the risk profile. If post-control residual risk remains too high, a further reassessment of any additional controls needed to reduce it to expected levels would be conducted.
The assessment of inherent and residual risk requires some determination of the likelihood of a risk, the possible severity, and any impact that would follow should it occur. Overall risk, typically measured in dollars of loss or costs to the firm, is defined as the product of a risk’s likelihood and severity. For example, probability distributions of incurring defects in BM and CM processes could be generated and used in conjunction with a defined risk tolerance (e.g., 99.5% confident of a defect rate < x% over a specified period of time) to assess manufacturing alternatives against a specific risk type (e.g., process risk). Likewise, the severity of such outcomes can be derived from actual or simulated data.
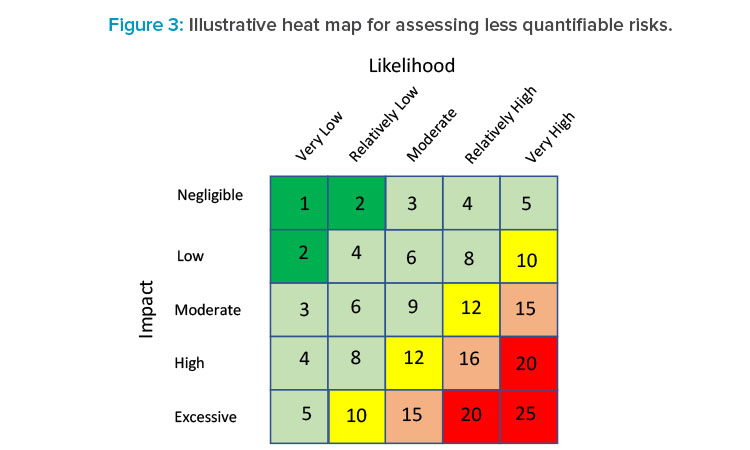
In the absence of empirical data on which to develop a reliable quantitative estimate of both components of some risks (e.g., people risk), heat maps are commonly used tools in many industries, including banking, especially to assess operational risk for rank ordering the likelihood and severity of a risk outcome and to provide an overall rating (red = very high risk, green = very low risk), as shown in Figure 3.
A heat map is flexible, allowing variation in the number of risk categories as well as the criteria for what defines each rating. In terms of assessing the likelihood of a risk, it is important to provide some general guidance of what distinguishes one risk rating from another. In Figure 3, for instance, a very low likelihood rating might represent those risks that occur less than 5% of the time. Such criteria are typically determined jointly between business and risk teams based on experience and judgment.
Factors that could be used in assessing the likelihood of a particular risk associated with CM might include the complexity of the process and technology. One of the touted benefits of CM is the degree of automation, which can potentially reduce manual intervention in the process and enable more seamless processing. That could very well reduce the likelihood of operational breakdowns as compared with batch processing.
Other potential considerations in assessing the likelihood of a risk associated with CM technology might be workforce experience level, competency, and CM labor supply. The likelihood that the supply of well-trained CM manufacturing operators may not be sufficient to ensure operation of a CM manufacturing facility would need to be determined and slotted into the appropriate likelihood risk rating.
The impact rating for a risk would take on a similar approach. In this case, the impact of a risk occurring can be multifaceted. A production stoppage could cost the firm lost revenues and/or costs associated with a breach of a service level agreement with a business counterparty, or potential legal and or regulatory costs, or reputation effects, for example. For each impact category some criteria should be established to differentiate each risk rating.
Consider the example of an unexpected shutdown during the manufacturing process. Events that pose losses of $1 million or less might be considered negligible impact, whereas those generating over $50 million might pose an extreme impact to the business. Although these figures are illustrative only, each company’s experience with risk events, the risk impact, and the company’s risk appetite would be essential in setting these risk thresholds.
Once likelihood and impact risk ratings have been developed for each CM risk, a final overall risk rating can be developed by combining both ratings. Figure 3 presents a 5 × 5 matrix for assigning final overall ratings. One way to determine those final ratings is to apply a numeric score shown to each of the five likelihood and five severity ratings. A rating of very low risk or negligible might, for instance, receive a score of 1, whereas very high or excessive risk might be assigned a score of 5. Then a simple multiplication of likelihood and severity ratings could be lined up against score thresholds for each overall rating. Applying this simple example, overall ratings would be classified based on score, as shown in Table 1.
- 3Knight, F. H. Risk, Uncertainty and Profit. New York: Houghton Mifflin Co., 1921. https://fraser.stlouisfed.org/files/docs/publications/books/risk/riskuncertaintyprofit.pdf
| Risk Rating | Total Points |
|---|---|
| Very high | ≥ 20 |
| Relatively high | 13–19 |
| Moderate | 10–12 |
| Relatively low | 3–9 |
| Very low | ≤ 2 |
These inherent risk ratings would be evaluated against various risk responses to bring the overall residual risk in alignment with the company’s risk appetite. Risk responses are either accept, avoid, reduce, or share. Controls would be established (e.g., CM standard operating procedures) to ensure that the final residual risk rating is at the appropriate level for that risk.
Once a CM project has been approved, ongoing assessment of plant performance is necessary. This is where both a set of KRIs and risk control self-assessments (RCSAs) become essential. KRIs provide ongoing benchmarks of performance around specific project risks. Commonly used quality metrics in place today could be suitable KRIs for managing process and technology risk. The percentage of manufacturing operators certified in QRM or other technical proficiency training could serve as a form of people risk KRI, for example.
KRIs for other risks such as financial performance or regulatory risk would be developed as well. Whatever KRIs are used should be actionable, transparent, replicable, and consistent across business processes. RCSAs, on the other hand, provide a periodic mechanism to track and prioritize emerging issues and risks, and establish remediation plans where appropriate and identify accountable parties. RCSA templates should be consistent across business areas to help manage operational risks across the company.
Manufacturing process QRM is an integral component of the overall risk management assessment framework. For years, pharmaceutical manufacturers have built these processes to conform with current good manufacturing practice (cGMP)4 regulations as well as various ICH quality standards such as ICH Q9 and Q105 and now Q136 for CM processes. Quality control lies at the heart of any robust risk management process, enabling firms to proactively identify process weaknesses and remediate them before they turn into a risk event. The FDA’s Quality Management Maturity (QMM) and Quality Metrics programs are the next evolution for companies to elevate their quality management programs.7
A number of industries also use expert scorecard tools to assess manufacturing quality including aerospace and automobile manufacturers. Building this capability into the risk management process for new technologies like CM establishes a critical control point for monitoring CM system performance.
Simulation Analysis to Evaluate CM Technology Viability
An ongoing challenge in the application of SRM is obtaining robust estimates of key risks where empirical data are limited, especially for assessing new manufacturing technologies. Given the lack of extensive historical CM investment and of financial and engineering operating data in pharmaceutical manufacturing, relying on a single set of best estimates to determine financial feasibility and risk of CM technology is insufficient. This is where simulation analysis can provide a more robust set of estimates of CM technical and financial performance over time by varying different key assumptions.
Net Present Value
Pharmaceutical manufacturers face a variety of financial risks. Financial risk in this context is defined as the shortfall in cash flow that arises from factors that affect firm profitability. Net cash flow, or net operating income (NOI), is defined as the dollar amount of cash inflows less cash outflows over some period, such as a year. Cash inflows are defined as all sources of revenues (R), such as from pharmaceutical sales, whereas cash outflows could include costs of goods sold (COGS), taxes (T), costs of hedging foreign exchange (HC) for a global pharma manufacturer, depreciation (D), research and development costs (R&D), and general and administrative costs (G&A). NOI is more formally defined as:
$$\text{NOI = R - COGS - G&A - D - T - R&D - HC}$$
Companies deciding whether a project is financially viable often rely on a single scenario: multiperiod discounted net present value (NPV) analysis or its variants. Traditionally, NPV analyses are performed in a deterministic manner, i.e., without any degree of uncertainty introduced.
NPV in this form can further be defined as follows:
$$NPV = \sum_{t=1}^T \frac{(Revenue_t-MOpEx^\alpha_t\Delta-NMOpEx_t-hc)(1-MTR_t)}{(1+r)^t}-MCapEx^\alpha_0\Delta$$
where:
- Revenue represents annual sales of the pharmaceutical OSD product
- MOpEx is manufacturing operating expense for technology a (i.e., BM or CM)
- NMOpex is nonmanufacturing annual costs
- hc represents foreign exchange hedging costs
- MTR is the marginal corporate tax rate for country i
- MCapEx is the capital cost associated with technology a
- r is the discount rate
Investment projects are viable if they are NPV positive.
Variability of NPV
Variability of NPV gives rise to financial risk. In the case of a firm’s financial risk, a company is concerned about having a project generate sufficient cash inflows to satisfactorily cover cash outflows over some time with a certain degree of confidence. However, endogenous or exogenous factors can introduce a degree of uncertainty into the NPV analysis. The nature of the product life cycle in the pharma industry contributes to cash flow variability in several ways.
For example, product pricing and sales fall once the product moves from having brand protection to generic status. Engineering cost uncertainty presents another source of financial risk to pharma manufacturers. From the standpoint of investing in advanced manufacturing technology, where limited hard data on investment and operating costs exists, companies need to consider upfront and ongoing cost uncertainty associated with new processes that do not have established track records in the industry.
This cost uncertainty can lessen interest in advanced technologies such as CM over standard batch technology, which has more extensive application in the industry. Simulation of financial outcomes over a range of possible and less likely outcomes can reduce this analytical challenge for CM and boost confidence in such projects’ results for estimating project feasibility compared to BM.
NPV value-at-risk
To illustrate this concept, assume that a company has determined that for any project it wants to be 99% confident that it will be NPV positive. The histogram in Figure 4 represents a discrete distribution of NPV outcomes for a company over a project’s life. On average, this company could expect to see an expected NPV amount E(NPV) that, in a normal year, would be some positive amount. However, depending on market conditions and other factors, a wide variation in NPV could occur over a year. Drivers of such variability could include changes in the amount of sales and/or unit pricing due to changes in product demand, degree of competition for a product, or variability in various cost components of NOI.
- 4US Food and Drug Administration. “Current Good Manufacturing Practice (CGMP) Regulations.” November 2022. www.fda.gov/drugs/pharmaceutical-quality-resources/current-good-manufacturing-practice-cgmp-regulations
- 5US Food and Drug Administration. “Guidance for Industry. ICH Q10 Pharmaceutical Quality System.” April 2009. www.fda.gov/media/71553/download
- 6US Food and Drug Administration. “Guidance for Industry. Q13 Continuous Manufacturing of Drug Substances and Drug Products.” March 2023. www.fda.gov/media/165775/download
- 7US Food and Drug Administration. “Quality Management Maturity: Essential for Stable U.S. Supply Chains of Quality Pharmaceuticals.” Office of Pharmaceutical Quality (OPQ) White Paper. Published 2022. https://www.fda.gov/media/157432/download
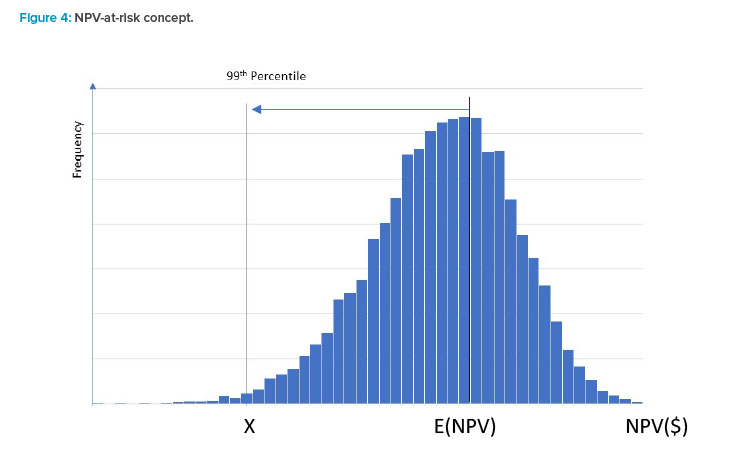
Given the desired target level of confidence, the firm in this example would want to manage its business in a manner to ensure its NPV does not fall below the level of X more than 1% of the time. This point would be referred to as the project’s NPV value-at-risk (VaR). Most NPV analyses only evaluate a single path of cashflows, which could be misleading if one or more components of NPV has some variability associated with it.
Introducing uncertainty into the NPV analysis
A standard way of introducing uncertainty into the NPV analysis is to represent key revenue and cost inputs as stochastic variables. A degree of randomness is introduced in measuring the stochastic variables by way of their standard deviation or volatility. Three stochastic variables were incorporated in the NPV model: revenue, MOpEx, and MCapEx were assumed to follow a generalized Weiner process with a constant drift rate and variance. The discrete form of each stochastic variable is represented by the following:
$$\frac{\Delta V}{V}=\mu \Delta t + \alpha \varepsilon \sqrt \Delta t$$
$$\Delta V = \mu V \Delta t + \alpha V \varepsilon \sqrt \Delta t$$
where µ is the drift rate, σ is the standard deviation (volatility) of variable V, and ε is a random normal variable. It is assumed, following convention with other cost studies, that operating and capital costs are lognormally rather than normally distributed as are revenues.8 The lognormal distribution ensures nonnegative costs and revenues, and better reflects the tendency that costs are more likely to go up than down.
Leveraging historical data augmented by sensitivity analysis of a variable’s volatility significantly upgrades a standard deterministic NPV analysis. Evaluating CM under a variety of cost outcomes can therefore provide considerably more confidence in the NPV results, particularly if NPV VaR is applied as a decision rule.
Brand vs. generics manufacturing example
To provide more insight on the potential for simulation-based methodologies to assess new manufacturing technologies such as CM, consider some findings from a recent study that developed a stochastic NPV simulation of brand and generics manufacturing for new facilities. NPV distributions of BM and CM processes in different countries9 were simulated leveraging actual industry financial revenue and cost information, and detailed engineering cost information of CM and CM processes from a seminal manufacturing cost analysis of these two technologies.10 The analysis considered 156 different domestic and foreign manufacturing scenarios under varying assumptions of revenue and cost uncertainty. The model generated 10,000 different NPVs from which NPV distributions were generated.
Figure 5 provides a summary of the comparison for brand companies deciding whether to manufacture in the U.S. leveraging CM vs. BM technology under three CM capital and operating cost volatility scenarios. The results suggest that for brand companies, NPV for CM-based technology is greater than that using a batch process across all cost volatility scenarios. Moreover, it should be noted that only under the most extreme cost volatility (i.e., increasing cost volatility by 15%) scenario and most conservative investment threshold (99th percentile) would BM NPV ever exceed CM NPV.
- 8NASA. “Appendix G: Cost Risk and Uncertainty Methodologies.” Cost Estimating Handbook Version 4.0. NASA.gov, 2015. https://www.nasa.gov/sites/default/files/files/CEH_AppG.pdf
- 9Rossi, C. “A Comparative Investment Analysis of Batch Versus Continuous Pharmaceutical Manufacturing Technologies.” Journal of Pharmaceutical Innovation (2022). doi:10.1007/s12247-021-09612-y
- 10Schaber, S. D., D. I. Gerogiorgis, R. Ramachandran, J. M. B. Evans, P. I. Barton, and B. L. Trout. “Economic Analysis of Integrated Continuous and Batch Pharmaceutical Manufacturing: A Case Study” Industrial and Engineering Chemistry Research 50, no. 17 (2011): 10083–92. doi:10.1021/ie2006752.
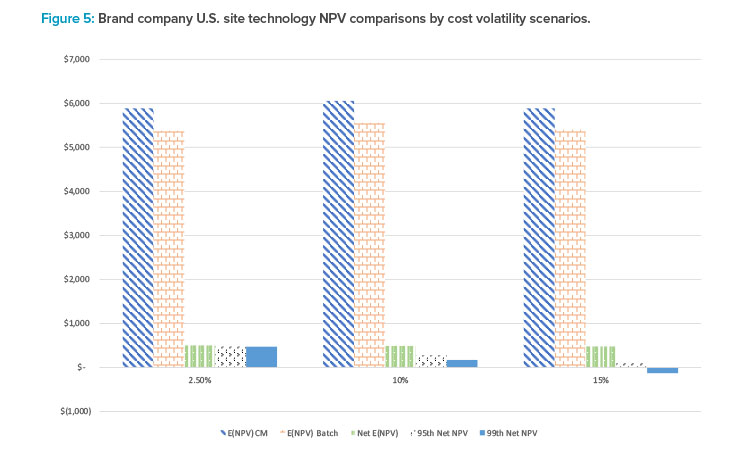
This suggests that, at least for U.S. sites, CM manufacturing should be the preferred technology choice for brand companies. Similar results for generics drug manufacturing as well as manufacturing scenarios for different countries were found and included in the full analysis, demonstrating the applicability and flexibility of simulation of CM technology NPV to a broad range of scenarios.
The benefit of scenario and simulation analysis is that it doesn’t rely on one set of financial model inputs. Rather, by generating a distribution of outcomes, it provides a probabilistic assessment of CM project financial performance that can be used to measure the financial risk of the project. By establishing a level of confidence (e.g., 99%) over a specified time horizon for which the project must be NPV positive it creates a consistent methodology that can be applied to other capital investment projects across the enterprise. NPV VaR provides a more conservative benchmark to evaluate projects than simply relying on expected NPV or even single scenario NPV results. This type of analysis is particularly useful for CM projects where uncertainty in key technical production, engineering, and financial parameters may exist.
Effective CM Process Risk Management
For decades, industry sectors such as banking have applied ERM principles in their businesses to assess existing and new products and services from a risk-adjusted return perspective over the entire product life cycle. ERM is a data- and analytical-driven discipline augmented with business judgment that is essential in today’s technology-driven business. Embracing a systemwide view of risk, especially for pharmaceutical manufacturers, enables companies to ensure that risks are managed in a consistent manner by applying standard risk management practices and controls. As pharmaceutical manufacturers consider leveraging CM technologies, SRM should begin to play a large role in that evaluation process, transcending traditional QRM practices by center-ing on a holistic and integrated approach to risk management across multiple risk types. A benefit from the SRM process is that it is repeatable for any business activity once put in place.
The ingredients of a sound SRM program require board and senior management commitment to risk management, a risk-aware culture, and the risk infrastructure to identify, measure, control, and mitigate risks. Without board and management support, SRM becomes an exercise in futility. Having CM serve as a use case to demonstrate the importance of SRM can cultivate support for it from the top of the organization while enhancing the CM evaluation process. By nature of their business, pharmaceutical companies are more risk-centric than other sectors, such as banking. In that regard, it may be easier to build the internal support and awareness for SRM.
Conclusion
For businesses unfamiliar with SRM principles and benefits, SRM can be viewed as an impediment. However, when properly introduced in a balanced risk–reward manner, SRM is, in fact, an enabler to assure that the company understands the risks it is taking and establishes clear benchmarks of performance on managing the risks it retains. Pharmaceutical manufacturing finds itself at an important inflection point technologically with the promise of advanced manufacturing capabilities such as CM to improve production quality, operational efficiency, and continuity. Pharmaceutical companies that leverage SRM principles will find this provides a distinct competitive advantage relative to peers in making more informed risk-based decisions not only for manufacturing but across the enterprise.