Optimizing Cost of Goods for Cell Therapy Manufacturing

Facility design decisions made early in conceptual design can have a significant impact on the cost of goods sold (COGS) in the manufacture of autologous and allogeneic cell therapy products. Understanding the impact of a COGS analysis is an important aspect of the early-phase design process.
For most cell therapies, emphasis is placed on the cost of starting materials, the protection and control of the supply chain, and the efficiency of manufacturing to support rapid cell processing. These requirements are discussed in detail within the content of the ISPE Guide: Advanced Therapy Medicinal Products (ATMPs) Autologous Cell Therapy.1 Organizations beginning the journey into clinical manufacturing will focus on the key topics outlined in the guide’s section on manufacturing, including process understanding around unit operations, equipment selection, and process control. But what about the COGS?
“The cost of any form of biologic product is weighed against its therapeutic benefit in its cost–benefit analysis. This assessment includes considering the relative costs of manufacturing. The affordability of many cell therapy products (CTPs) is often driven by factors related to development, clinical manufacturing logistics, and facility optimization. Since many CTP processes are not yet considered ‘robust’ due to their lack of manufacturing support data, the question around COGS sometimes is not given its appropriate emphasis during early-phase design activities.”2 ,3
“Specific factors to consider include analytical testing, operational attributes, product protection strategy, manufacturing logistics, and technology solutions.”3 ,4 A number of factors impact COGS, including direct costs (labor, materials, and sampling); indirect costs (operating costs, consumables, and testing); and amortization/depreciation costs (facilities, equipment, and third-party services). Addressing these factors can produce significant data options for consideration during conceptual design.
Methodology
“The design of a manufacturing process for any biopharmaceutical product involves a proven methodology that includes criteria such as operating costs, capital investment costs, and manufacturing reliability and efficiency. Developing COGS values that are specifically driven by the attributes of the process/facility relationship will focus on a set of inputs and outputs that have a direct day-to-day impact on operational costs and manufacturing efficiency.”3
“The key is to have a tool that will provide the necessary data for evaluation while also making the data accessible during the design phase of the project. As design attributes change, so will the data. The tool should be user friendly and easy to implement.”3 Figure 1 provides a visual example of how a decisional model can be created.
“The inputs required to evaluate manufacturing costs would include personnel requirements; unit operational data; batch size; operational scale; qualification data; and materials and consumables.
For early-phase design development, the focus is on defining the established fixed costs that can be supported with available data, including:
- Equipment sizing/vendor data: In the model process, all unit operations are performed in single-use components. This is driven by scale of operation, flexibility, and level of automation. For this model, unit operations are assumed to remain manual-focused during the clinical manufacturing phases, consistent with many operations producing chimeric antigen receptor T (CAR T) cell products today. Key information would include product protection via biosafety cabinet (BSC)/isolator; cell processing via cell enrichment and cell washing; concentration; filling; and cryo storage.
- Utility consumption: Load calculations based on facility attributes (heating, ventilation, and air conditioning unit sizing/zoning) and average energy cost (localized).
- Area sizing/classification: Energy usage intensity and operations schedule.
- Consumable costs based on target manufacturing outputs: Bags, micro beads, bottles, pipettes, and tubing.
- 1International Society for Pharmaceutical Engineering. ISPE Guide: Advanced Therapy Medicinal Products (ATMPs) – Autologous Cell Therapy Products. Section 4.2.1. North Bethesda, MD: International Society for Pharmaceutical Engineering, 2021.
- 2Dream, R., and J. Odum. “Impact of ATMP Manufacturing on Process Equipment and Facility Design.” BioPharm International 31, no. 11 (1 November 2018):30–34. www.biopharminternational.com/view/impact-atmp-manufacturing-process-equipment-and-facility-design
- 3 a b c d Odum, J. “Engineering Angles: Optimizing COGs in Cell Therapy Manufacturing.” Pharma Manufacturing. 8 December 2022. www.pharmamanufacturing.com/facilities/article/21437787/optimizing-cogs-in-cell-therapy-manufacturing
- 4Meurer, E. “Cutting Costs for Cutting Edge Therapeutic Products: ATMP Process Optimization.” Biopharma Excellence Insights. 4 December 2018. www.biopharma-excellence.com/2018-12-4-cutting-costs-for-cutting-edge-therapeutic-products-atmp-process-optimization/
![Figure 1: Sample decision model [5].](/sites/default/files/2023-11/1123_PE_ND_Odum_02.jpg)
There will also be a need to identify key assumptions necessary to complete the COGS model: batch targets based on manufacturing time durations; testing requirements; headcount, measured in full-time employees; energy costs; annual maintenance costs; and scaled facility costs (tax rates).”3
Tools
The tools that evaluate different production scenarios to aid in compiling costs depend on accurate data, or valid assumptions that cover the necessary cost model attributes. These tools can be either manual worksheets that use macros to automatically adjust data entry on a cell-by-cell basis in the spreadsheet or computer-generated models.
The key to success in generating numbers that have meaning and validity is the strength of the data input; “garbage in, garbage out” truly applies. Some examples:
- Equipment costs based on actual purchase price or validated bid price
- Accurate energy costs in dollars per kilowatt hour ($/kWh) based on actual monthly bills
- Mass balance volume accuracy for each unit operation
- Consumables costs: Equipment and personnel assigned units
- Sampling: Environmental monitoring and process costs and frequency
- Materials: Volume and cost per unit
Data entry must be specific and accurate. A worksheet tool would include items such as:
- Item type: Equipment type, price, and quantity
- Materials: A description of each line item
- Base UoM: The unit of measure for each item in the purchasing unit, e.g., ea. (each), L (liter), or g (gram)
- Purchase amount: Quantity purchased based on unit of measure
- Purchase price: Cost of each item purchased based on unit of measure
- Unit of measure quantity per patient: Quantity of the unit of measure used for each patient.
Use of the Tool
To show the use of a tool focused on design input, a CAR T clinical/launch facility will be used as a model. In this basic model, the facility has the following set of operational attributes defined and included as factors during conceptual development: a focus on CAR T CTPs; phase 1, 2, and 3 clinical manufacturing; Grade A BSC in Grade B background classification basis for manufacturing; a 15-year amortization period; consistent average energy cost ($/kWh) for utility costs; and annual taxes and maintenance costs. A phased expansion approach to meet increasing manufacturing demands for clinicals will include manufacturing and support spaces. In phase 1, 15,000 sq. ft. will be used, followed by 45,000 sq. ft. in phase 2, and 90,000 sq. ft. in phase 3.
For the equipment platforms, the facility has the following set of operational attributes defined and included as factors during conceptual development: consistent unit operations through all phases of clinical manufacturing; equipment pricing based on current quotes within the last 12 months; operations classified as “open” requiring Grade B classification; facility designed to allow for equipment additions as phasing dictates (phase 1, 30 cam-paigns annually; phase 2, 40 campaigns annually; and phase 3, 50 campaigns annually); and a 10-year amortization period.
The supplies required are estimated on a per-patient basis for the following: consumables, raw materials, gowning, cleaning, environmental monitoring, and storage and shipping. Personnel inputs are based on the defined CAR T process design and target production output for defined patient populations for each study phase. The focus of the model is on production, compliance, and supervisory personnel. The factors include compensation rates for salaried and hourly personnel, two eight-hour shifts per day, and a general factor for benefits based on compensation.
Results
For this model, which implemented a manual tool, the request was to define a per-patient COGS estimate for each clinical phase, based on the following patient populations: 60 patients in phase 1, 600 patients in phase 2, and 1,500 patients in phase 3. Using these data parameters, Table 1 shows the representative estimates for COGS on a per-patient basis.
Facility Design Attributes
The impact on facility design attributes on COGS is driven by a number of data elements, as outlined next.
Manufacturing area
As the need for manufacturing capacity increases due to the number of patients that can become part of a defined campaign, the need for increased space to handle increased equipment and operational personnel also increases. Moving from a phase 1 two-patient campaign to increased numbers of patients will require more physical space. If this space is maintained in the same environmental classification for all clinical phases, this will result in an increase in both total installed cost and annual operational costs driven significantly by utilities.
Process utilization
Production costs decrease when the production rate (number of patients) is increased.
Utilities
Although equipment scale is small, the addition of new BSCs and increases in overall electrical consumption—along with slight increases in water usage—will increase annual utility costs by approximately $1.6 million.
| Estimates | Phase 1 | Phase 2 | Phase 3 |
|---|---|---|---|
| Annual cost | $22,685,788 | $48,828,708 | $94,798,320 |
| Personnel cost | $3,610,100 | $9,452,298 | $20,985,900 |
| Facility cost | $16,666,628 | $17,239,032 | $18,373,020 |
| Material/supplies cost | $2,160,000 | $21,600,000 | $54,000,000 |
| Equipment cost | $249,060 | $537,378 | $1,439,400 |
| Cost per patient | $378,096 | $81,381 | $63,199 |
Environmental classification
The ability to implement process closure via equipment design solutions and operational control can have significant impact on annual operational costs. Moving from a Grade A/Grade B environmental product protection solution to a more robust protection solution, such as isolators, can result in reductions in area classifications, decreased environmental monitoring requirements, reduced gowning protocols, reduced cleaning protocols, and reductions in air handler sizing.
Process closure
As an example, for the implementation of process closure, a significant amount of work has been done to support the argument that closed system implementation has a significant impact on COGS.
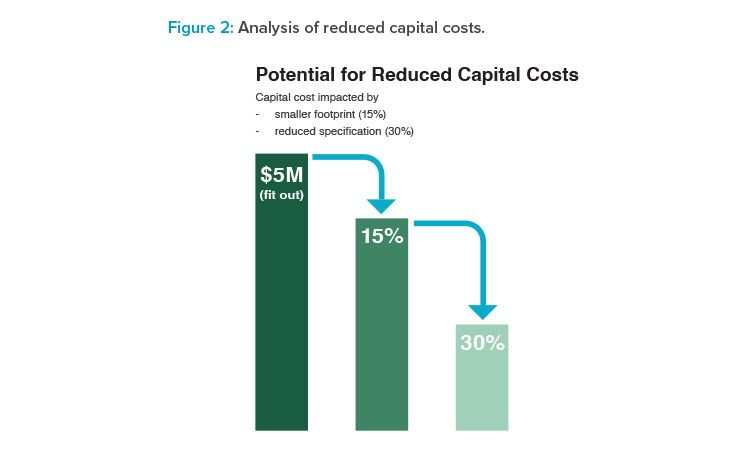
Capital Cost Reductions
BioPhorum developed a case study6 that identified potential capital cost reductions, a key component of COGS development. The implementation of this particular design attribute produces benefits like energy conservation, reduced facility capital and operating cost, shorter facility construction and qualification times, enhanced facility throughput and operational flexibility, reduced COGS, and speed to market; all while maintaining product quality standards (see Figure 2).
| Expense | Phase 1 | Phase 2 | Phase 3 |
|---|---|---|---|
| Personnel | $60,168 | $15,754 | $13,991 |
| Facility | $277,777 | $28,732 | $12,249 |
| Material and supplies | $36,000 | $36,000 | $36,000 |
| Equipment | $4,151 | $896 | $960 |
| Cost per patient | $378,096 | $81,381 | $63,199 |
Capital cost reductions have significant impact on COGS. These reductions are defined in the early-phase design efforts.
The single-patient focus of CAR T manufacturing creates scale-up challenges for facility design as patient population increases. In this model, facility size is made up of the actual manufacturing space, laboratory/testing space, office/administrative space, and general assumptions on warehousing and miscellaneous space. The general COGS patient values are established as:
\(\text{COGS/patient}=\sum \frac{materials/supplies + labor + testing + indirects}{annual \; patients}\)
It is also important to validate all key model assumptions. These would include patient numbers and how many doses per patient, facility product platform allocation, target throughput per campaign, environmental monitoring sample requirements, qualification costs, automation implementation, baseline total installed costs (TICs) per sq. ft. based on classification, power consumption factors and energy usage intensity, gowning costs per operator, benefit cost, and storage and supply chain.
Conclusion
The design decisions made during conceptual design of a manufacturing asset for CTPs have consequential impacts on not only facility capital costs, but also on COGS. “During clinical trials, there is tremendous focus of trial costs as companies reach their phase 3 trials. Decisions made years before in facility design will impact these per-patient values more than many might think. Costs for raw materials, reagents, starting materials, labor, utilities, and consumables will be driven by market conditions; very little impact can be influenced to reduce/improve market reality. But the facility attributes that impact day-to-day operational costs and manufacturing efficiency, once established, will become baseline, as seen in this COGS model. Speed to market, flexibility and efficiency, and regulatory qualification/compliance are impacted by the decisions about COGS at baseline.
Implementing COGs analysis during early-phase facility planning brings value by shedding light on areas of operational cost risk, future per-patient tri-al costs impacted by facility attributes, and identification of options for consideration in equipment selection and facility design.
By looking at COGS distribution for each clinical phase, it can easily be seen where facility design decisions have the greatest impact.”3 In the following cost breakdown graphics, the cost impacts from personnel, materials and supplies, equipment, and facility attributes are easily seen. The ear-ly-phase facility design decisions will have a significant impact on COGS. The details from this model for each clinical phase are presented in Table 2.
Understanding the impact of early-phase design on COGS can support some of the decisions made in equipment selection, area classification designation, segregation strategy, sampling methodology, and operational strategy. These should not be random decisions focused on past approaches. For organizations developing early-stage clinical manufacturing assets for CTP, these decisions will have significant impact on future business models as products enter late-stage development and commercial launch. Optimizing costs early is the goal.
- 6BioPhorum. “Closed Systems: Data Driven Equipment and Facility Design Case Study.” BioPhorum. May 2020. www.biophorum.com/download/data-driven-equipment-and-facility-design-case-study/
- 3
Acknowledgments
The author would like to acknowledge David Raab, Senior Process Engineer at Genesis AEC, for his assistance in model adaptation.