Performance & Validation of Ozone Generation for Pharma Water Systems

Despite the advantages of ozone technology as a powerful commercially available oxidant and disinfectant, this technology has not been adopted broadly by the pharmaceutical industry. This article contains the rationale for applying ozone technology in a packaged system, which offers greater reliability and efficacy, using best practices that eliminate variables common in on-site integrated ozone systems. This approach is novel and innovative; it provides known results with new tools that quantify and estimate mass transfer efficiency, decrease the risk of misapplication, and increase success.
Virtually all users of pharmaceutical water systems pursue lower maintenance and operational costs, increased reliability, and improved life cycle management. Biopharmaceutical companies are looking for innovative methods and newer technology to increase throughput, quality, and uptime.
Ozone technology delivers the most powerful commercially available oxidant and disinfectant with few detrimental or detracting issues. Ozone sanitization and disinfection has been used for decades, and its adoption in pharmaceutical water systems has been increasing for several years, although it has not yet been adopted broadly in the industry.
When used in lieu of hot water or chemical sanitization for ambient-temperature purified-water systems, ozone prevents the accumulation of microbials and organics and requires less maintenance over the life cycle of the water system. In addition, at 24/7 administration ozone is:
- 85% less expensive than hot water sanitization five times a week
- 20% less expensive than once-weekly hot water sanitization
- Tens of thousands of dollars less than twice yearly chemical sanitization 1 ,2
This paper emphasizes the need to understand this technology, its efficacy, and adoption into pharmaceutical water systems to address problems and limitations of legacy processes. This article also explores the efficacy of applying ozone technology in a “packaged” system using best practices. This approach eliminates variables common in on-site integrated ozone systems, and allows easier implementation at lower cost, with better and more predictable results.
BACKGROUND
Ozone (O₃) is triatomic oxygen, which oxidizes carbon compounds in water to carbon dioxide (CO2 ) when sufficient ozone and time are provided. (Many complex organics oxidize to smaller complex compounds before oxidation to CO2.) Since microbials, bacteria, pathogens, and endotoxins all contain carbon, ozone is an excellent biocide that destroys these organisms by oxidation.
There are three ways to produce ozone:
Electrolysis produces small amounts of ozone in situ from the water system. This method cannot adjust readily to dynamic conditions when loading requirements can change quickly.
UV production is a viable ozone-generating method but has limitations of cost, efficiency, and concentration; it is also energy inefficient when compared to other methods.
Corona discharge is the most efficient commercialized method for ozone production. It uses a reaction chamber with a dielectric barrier in which high voltage is applied to an oxygen feed gas to generate ozone. Modern corona discharge units are adjustable to throttle ozone production up or down under dynamic conditions when load and demands change. Most advanced corona discharge ozone generators use enriched oxygen from oxygen concentrators (usually +90% by weight) as the feed gas due to more efficient ozone production and lower overall operating costs.
OZONE EFFICIENCY
Ozone has a short half-life (the time required for the ozone concentration to dissipate to 50%). In 25˚C water, 50% of the ozone decays in approximately 15 minutes (Table A). Different temperatures and water chemistries influence this rate. Ozone reverts to oxygen more rapidly at higher temperatures, for example. Ozone’s short half-life allows disinfection regimes to be calculated easily, according to the concentration required to achieve the desired effect: maintaining pristine systems devoid of microbials and organics. The box below, Compensating for ozone half-life, shows a simplified example of these calculations and how to assess the ozone needed for a given concentration.
| °C | Minutes |
|---|---|
| 15 | 30 |
| 20 | 20 |
| 25 | 15 |
| 30 | 12 |
| 35 | 8 |
Compensating for ozone half-life
\( O_3 n/HL∝ = O_3 c \)
Where:
O3 n: Not compensated for half-life of ozone destruction, amount of ozone required to achieve and maintain desired ozone concentration,
HL: Half-life of ozone according to the water temperature from the table above
O3 c: Compensated or actual amount of ozone required to be injected in order to maintain residual concentration at the actual water temperature.
Using the relationship and above data, in this case at 25˚C, 10 g / 0.25 hour = 40 g or four times more than without compensation for ozone destruction in water because of half-life.
Source: “How to Compensate for Half-Life of Ozone.” © Absolute Ozone. www.absoluteozone.com. Reprinted with permission.
AQUEOUS OZONE PROCESS
The aqueous ozone process consists of four steps:
- Ozone generation
- Mass transfer
- Concentration and contact (residence) time
- Process control
Ozone generation
As noted above, modern corona discharge ozone generators produce gas on-site, with control capability for increasing or decreasing output. They may include an air dryer or oxygen concentrator for feed gas preparation, as well as filtration, gas flow control, and gas concentration control.
Mass transfer
In the mass transfer process, ozone is dissolved in water. Ozone is more soluble in water than oxygen, although its solubility is dependent on the temperature, pressure, and other factors.
When designing an efficient mass-transfer process, bubble size is a critical parameter. Mitani et.al. stated “[T]he smaller the bubble size, the greater the mass transfer rate of gas. The larger surface area to volume ratio of very small bubbles provides an overall larger area for ozone mass transfer to occur.”3 The interaction of the bubbles with the water promote higher mass transfer efficiency (MTE), resulting in higher oxidation and disinfection efficiency due to the greater ozone diffusion in the water. 4 For best efficiency, bubbles should be 1 micrometer (μm) or smaller.
Larger bubbles reduce mass transfer and cause greater off-gassing of undissolved ozone, which translates into a loss of MTE. Bubbles coalesce, increase in size, and migrate to the upper surfaces of the water, accumulating in the head space of the tank or pipe. This off-gas must be collected, controlled, and decomposed to oxygen before it can be discharged.
A well-designed mass transfer system will create and manage the surface area for a reliable MTE ratio that is typically greater than 90%, which means that 90% of the ozone gas produced is transferred into solution. The gas-to-liquid ratio is paramount when calculating anticipated MTE of an ozone mass transfer system. An improperly sized and/or designed system can waste or fail to dissolve much of the ozone produced, causing inefficient and expensive operations.
Definitions
Sizing (mg/l): Amount of ozone delivered to a process
Mass transfer efficiency (MTE): percentage of ozone applied minus the immediate loss of consumption
Ozone demand (mg/l): Amount of ozone consumed by oxidizable material; must be determined empirically
Demand factors: Temperature, pH, organic content, etc.
Sizing
This is the amount of ozone the generator produces, based on the dosage needed to establish proper oxidation and disinfection.
Calculations for sizing an ozone generator and mass transfer system are based on temperature of the water, contact time (see below), ozone concentration and half-life, volume of water to be treated, and flow rates. Considerations must include MTE, which is the ratio of ozone dissolved, total ozone demand (including the decay rate), and concentration of oxidizable material in the water that will consume dissolved ozone.5
Correct sizing is critical as MTE, decay rate, and ozone demand can change rapidly with organic loading and process changes including water temperature and pH variations.5 Pharmaceutical water quality and conditions tend to be less dynamic, but are susceptible to seasonal changes, enhancing the need for good sizing practices. These start with a proper mass calculation, acceptable process and safety margins, and sizing to account for dynamic operational ranges.
- 1Cohen, Nissan. “Comparison of Ozone and Hot Water Sanitization in Pharmaceutical Water Systems.” ISPE Water Conference, June 2010, Arlington, Virginia, US.
- 2———. “The Efficacy of Ozone and Chemical Sanitization for Microbial Control.” Ultrapure Water Pharmaceutical Conference. June 2013, Lombard, Illinois, US.
- 3Mitani, Marie M., Arturo A. Keller, Orville C. Sandall, and Robert G. Rinker. “Mass Transfer of Ozone Using a Microporous Diffuser Reactor System”, Ozone: Science and Engineering 27 (February 2005): 45–51.
- 4Roustan, M., R.Y. Want, and D. Wolbert. ‘‘Modeling Hydrodynamics and Mass Transfer Parameters in a Continuous Ozone Bubble Column’’, Ozone: Science and Engineering 18, no. 2 (1996):99–115.
- 5 a b Wright, Philip Craig. “Mathematical Model for the Mass Transfer of Ozone into Water Systems.” University of Wollongong Thesis Collection, 1993. http://ro.uow.edu.au/cgi/viewcontent.cgi?article=3519&context=theses
Concentration
The concentration of ozone dissolved in the water (DO₃) is expressed as a mass volume percent. DO₃ is dependent on MTE and the mixing of dissolved ozone with the volume of water. To meet oxidation and disinfection goals, the ozone solution must be mixed promptly with the surrounding water in the tank to deliver a homogenous single-phase solution.
Due to ozone’s short half-life and the ongoing demand to oxidize organic material in the water, it is extremely important to replenish the ozone continuously to maintain a steady-state concentration. The box below, Solubility of ozone in fluids: Henry’s Law, shows ozone solubility calculations using Henry’s Law. At 45˚C, for example, ozone’s shorter half-life results in rapid decay and less contact time with the organics in the water. This reduces the level and efficiency of oxidation unless the decay rate is overcome by adding more ozone to maintain a steady-state concentration. Conversely, in colder water ozone has a longer half-life—although its reaction can be slightly slower—and less ozone is needed to maintain the concentration.
Ambient-temperature waters are ideal for ozone disinfection and maintaining concentration. Ozone is more soluble at ambient temperatures than at warm or hot temperatures, and more ozone gas produced by the generator is transferred into the water. This increases the efficiency of the mass-transfer process and consistency of the disinfection process.
Contact time
Contact (or residence) time becomes a crucial parameter when trying to calculate concentration and time values following the MTE for any given water system. Concentration and time value is measured in milligrams of DO₃ per liter of water multiplied by the reaction time in minutes. This is an accepted methodology for measuring and validating disinfection, and for defining and designing an ozone system. A known MTE from a well-designed and verified system with uniform mixing, therefore, will ensure the water is in contact with the ozone long enough and at a concentration high enough to deliver reliable disinfection results.
Control
A well-designed ozone system must include the instruments necessary for control of the unstable and highly reactive gas. The technology required for good ozone process control includes instruments to measure DO₃ (with feedback control), ambient ozone (for safety and OSHA compliance), ozone gas production flow and pressure, and hydraulic parameters that influence mass transfer.
Solubility of ozone in fluids: Henry’s Law
The maximum achievable balancing concentration of gas in fluids
CLiquid = CGas × ß(Temperature) × PGas
Where:
CLiquid: Dissolved concentration in liquid
CGas: Gas concentration
ß: Bunsen coefficient (solubility), temperature dependent
PGas: Gas pressure
Source: MKS Instruments, Inc. “Plasma and Reactive Gas Solutions: Ozone Data & Conversion Tables.” © 2004 MKS Instruments, Inc. www.mksinst.com. Reprinted with permission.
Compensating for ozone half-life
\( O_3 n/HL∝ = O_3 c \)
Where:
O3 n: Not compensated for half-life of ozone destruction, amount of ozone required to achieve and maintain desired ozone concentration,
HL: Half-life of ozone according to the water temperature from the table above
O3 c: Compensated or actual amount of ozone required to be injected in order to maintain residual concentration at the actual water temperature.
Using the relationship and above data, in this case at 25˚C, 10 g / 0.25 hour = 40 g or four times more than without compensation for ozone destruction in water because of half-life.
Source: “How to Compensate for Half-Life of Ozone.” © Absolute Ozone. www.absoluteozone.com. Reprinted with permission.
PACKAGED OZONE SYSTEMS
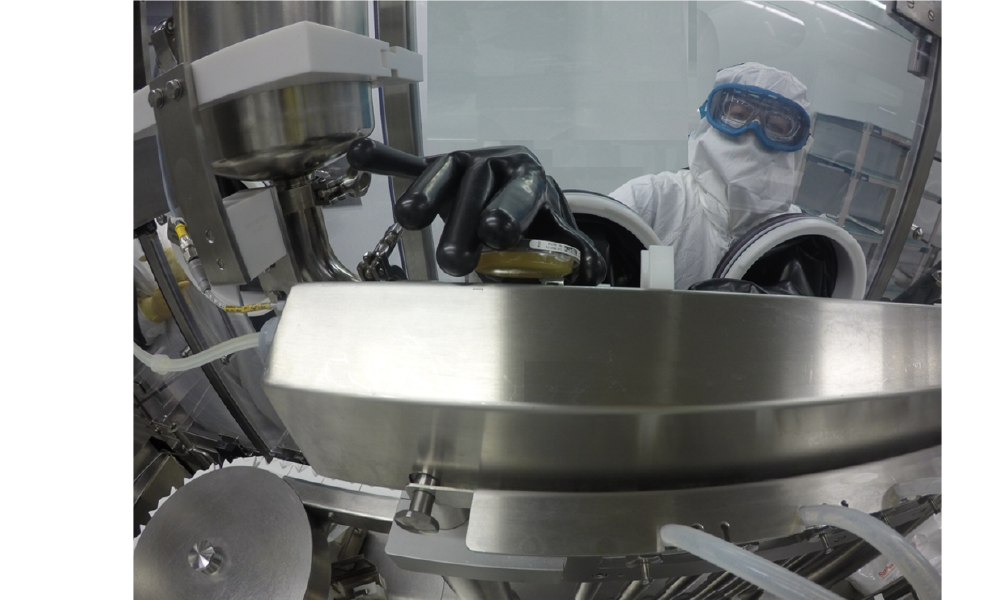
To configure and control the variables inherent in oxidation processes, packaged ozone systems can minimize the discrepancies associated with individual components and maximize the efficiency and ease of system validation. Components can be tested, integrated, and validated for all performance characteristics by the manufacturer using process analytical technology (PAT), since all measurement, testing, and feedback mechanisms are integrated. This enables monitoring and verification of all instrumentation and process parameters in real time, and offers immediate information on the process and its adherence to the user requirements specifications. The installation/operational qualification (IOQ) phase can easily be integrated; commissioning and qualification can be performed readily with continuous monitoring, using PAT for validation.
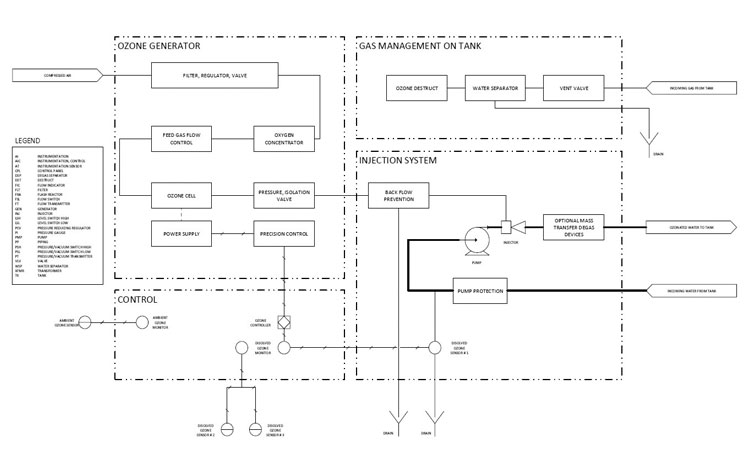
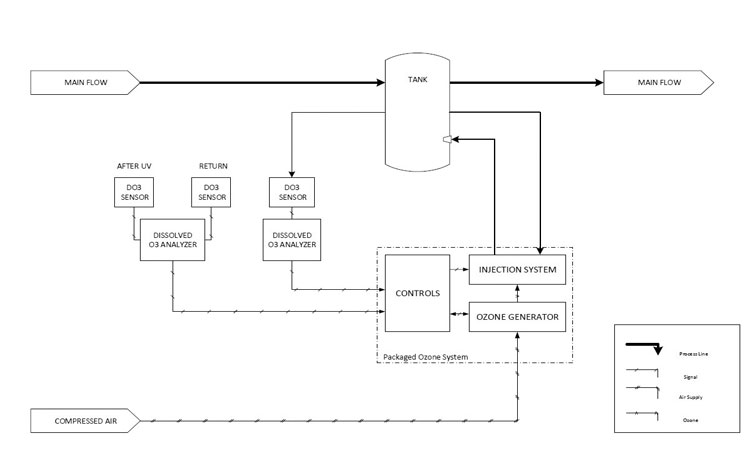
Typical components include an ozone generator, oxygen concentrator, venturi mixing device, mixing tank or vessel, ozone concentration monitor, ambient ozone monitor, various valves, and sometimes an ultraviolet (UV) lamp for ozone destruction (See Figures 1 and 2).
The ozone generator is the system’s workhorse, using the corona discharge method to generate ozone from oxygen. The oxygen concentrator uses compressed air, which has an oxygen level of approximately 20% and increases the oxygen level to approximately 90% as feed gas to the corona discharge unit of the ozone generator.
The ozone gas is transferred into the water stream using a venturi or another microbubble device. This dissolves the ozone gas into the water and promotes the mass transfer process. A properly selected venturi, plus related piping and pump arrangements will ensure the gas-to-liquid ratio and bubble size to meet design requirements. A packaged ozone system also typically incorporates an injection assembly that may include a venturi, nozzles, shearing devices, and degas separators that define the pump characteristics required for the process.
The ozonated water is delivered to a tank or vessel to oxidize and destroy carbon-based organics in the water. Good mixing and fluid dynamics in the tank are integral and should also be part of the system design. Tank nozzles, connection locations, level, and flow conditions should all be considered. Flow-through characteristics within the vessel and a DO₃ monitor should ensure uniform mixing, tight control capabilities, and avoid short circuiting.
Precise DO₃ concentration control within the tank under all operating conditions is imperative to achieve expected destruction of organics and microbials.6 DO₃ concentration monitors measure ozone concentration in real time as either parts per million or parts per billion. Feedback control
sends a signal to the ozone generator to adjust the gas output to maintain a targeted DO₃ concentration and microbial-free system. An ozone gas monitor for the airborne environment is installed to comply with OSHA standards (Figure 2).7
"Packaged ozone systems can minimize the discrepancies associated with individual components"
Advantages
Even the best biopharmaceutical water systems are dynamic, with seasonal and other influences that can cause chemistry and temperature changes that affect the growth and concentration of microbials and organic material. Despite fluctuations in the water quality, properly sized packaged ozone systems can maintain pristine conditions using science-based approaches for control, monitoring, and administration. 8 They can also be easily throttled for increased or decreased ozone production.
MTE ratios are straightforwardly calculated and ozone demand can be recalculated in real time when fluctuating water chemistry or loading occurs. When devising IOQ and range tests, ozone production can be adjusted and monitored to match intended output and concentration. Packaged ozone systems can be tested under wet conditions and thus commissioned and qualified, verified, validated, and used in PAT schemes. Packaged ozone systems replace uncertain or ill-defined output with a science-based, quantifiable output.
CONCLUSIONS
Calculations for ozone solubility and efficacy are dependent on water temperature, organic loading, half-life, concentration targets, tank or piping volume, and requested ozone residual. Packaged ozone systems can calculate and compensate for these factors, reduce implementation risk, and provide a better, lower-cost, and more reliable disinfection process for high-purity pharmaceutical water systems. The systems’ immediate feedback, control mechanisms, and built-in safety features can alleviate onerous IOQ and validation procedures and adhere to PAT protocols. Since all data is recorded and available while complying with FDA’s 21 CFR part 11, current good manufacturing practice compliance is discernible.
- 6Cohen, Nissan. “Understanding Dissolved Ozone and Its Use in Pharmaceutical Water Systems.” Pharmaceutical Engineering Knowledge Brief, KB-0028-MAY13, May 2013. http:// www.ispe.org/knowledge-briefs/dissolved-ozone.pdf
- 7US Code of Federal Regulations. Title 29, Standard 1910.1000 Table Z-1. “Limits for Air Contaminants.” https://www.osha.gov/pls/oshaweb/owadisp.show_document?p_table=standards&p_id=9992
- 8ISPE. Ozone Sanitization of Pharmaceutical Water Systems Good Practice Guide. July 2012.