Finding Relationships Between Clinical Batch Quality Data & Patient Outcomes

Understanding how variability in biopharmaceutical product quality, manufacturing, and controls (CMC) affects both safety and efficacy is a major goal in pharmaceutical quality. The increasing number of software packages available to manage “big data” has greatly improved the ability to assess the criticality of biopharmaceutical product quality attributes. These advances in technology have not gone unnoticed by regulatory agencies, which now require greater understanding of critical quality attributes in relation to patient safety and drug efficacy.
Yet industry-wide technical and organizational difficulties frequently prevent correlations between CMC data and patient outcomes, production processes, and product quality. It’s important to understand why this is so:
- Biopharmaceutical companies, partially in response to regulatory drivers, generate increasing amounts of data through initiatives such as quality by design, process analytical technology, process characterization, and continued process verification, along with new manufacturing and measurement technologies.
- Drug developers require better ways of using their process and quality data for statistical investigations and analyses, such as correlations that can help support patient-focused business decisions.
- Even today, in organizations of all sizes, much data is still captured manually and stored in spreadsheets. In addition, structured data often reside in separate and mutually incompatible databases, making aggregation difficult.
Consequently, it has been difficult to gather, organize, and contextualize data to improve knowledge of process and production operations, maintain and share this knowledge, and ensure appropriate levels of privacy. The US Food and Drug Administration (FDA) acknowledges as much in its “Process Validation: General Principles and Practices” Guidance for Industry: 1
- Focusing exclusively on qualification efforts without also understanding the manufacturing process and its variability may lead to inadequate assurance of quality. Each manufacturer should judge whether it has gained sufficient understanding to provide a high degree of assurance in its manufacturing process to justify commercial distribution of the product.
The same guidance presents the following list for manufacturers:
- Understand the sources of variation
- Detect the presence and degree of variation
- Understand the impact of variation on the process and ultimately on product attributes
- Control the variation in a manner commensurate with the risk it represents to the process and product
A report by Shashilov and Neway that explored the link between upstream process parameters and downstream product quality outcomes, noted the following:
- [A]n important benefit of being able to easily perform upstream/downstream correlations in complex manufacturing processes is that significant barriers are removed to identifying potential cause-and-effect relationships between upstream process conditions and downstream process outcomes. Such relationships drive the formation of hypotheses that can be confirmed, extended or refuted using mechanistic knowledge and/or experimentation. The information thus gained about the relationships between upstream process parameters and downstream process outcomes is a major component of process models used for process control, and also contributes in the development of sophisticated process models for use in real time adaptive control (RTAC).2
The aim of this study was to leverage the work of Shashilov and Neway, to explore the link between product quality (specifically impurity levels) resulting from manufacturing process variability, and patient outcomes. Specifically, the authors wanted to better understand:
- Whether process parameters driving product quality profile outcomes matched the clinical needs
- Whether quality attributes impacted patient responses
- Whether immunogenicity (safety) could be correlated with quality attributes
- Whether the levels of product related impurities that were administered to patients could be estimated reliably
Methodology
This article reports on a retrospective study using historical CMC and clinical data sets. We chose this approach because:
- It had a relatively low cost compared to a designed study, as it could use existing data without the expense of changing the clinical study design and/or data-gathering requirements.
- It was a pilot, and a proactive approach is needed before the design of a clinical study.
CMC data
The data sources used were:
- GMP pilot-scale batches producing drug product used in clinical trials. We collected release-testing and some process-execution information from paper batch records.
- Process development batches: We collected most of the laboratory experiment data from spreadsheets.
- CMC: Internal and external contract manufacturing organization (CMO) data, including:
- General batch data, including raw materials, cell lines, and associated quality attributes (critical material attributes)
- Critical process parameters
- Release data and in-process control (key and critical quality attributes)
- Stability data (e.g., purity)
- Supply chain data to confirm that the drug product was maintained within specifications during transport to the clinic
- Temperature excursions during transport
Clinical trial data
- Lists of kits used in clinical trials (individual kits contained one or more syringes to meet a total active ingredient quantity, as required in the clinical trial plan); each kit contained drug product from one or two production and/or placebo batches
- Clinical trial plans listing planned and actual individual patient treatments and the kits used
- Patient characteristics (e.g., age, sex, body mass index)
- Treatment type and details (visit dates, doses injected, etc.)
- Adverse events (number and type)
- Individual patient treatment response
- Physiological data (e.g., immunoglobulin G levels)
Clinical teams extracted specific data on demand to be incorporated in this study. This ensured that patient confidentiality and anonymity were maintained and clinical data sets were interpreted correctly.
Establishing data set genealogies
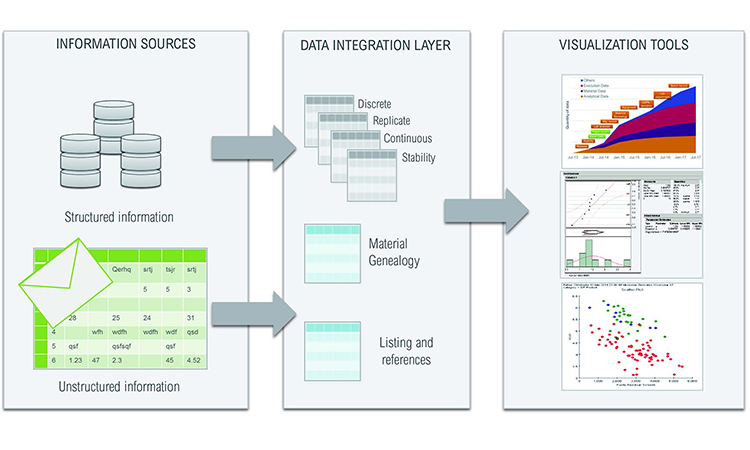
We used a commercially available fully integrated data access, aggregation, contextualization, analysis, and reporting software system to align data from multiple sources to a single organizing principle (e.g., a process batch). This created a single data structure that could be used for meaningful comparisons independent of various data elements origins (geographic locations, data sources, and business functions).
To simplify data integration, we designed an intermediate data layer that was integrated according to its format rather than its content (e.g., discrete, replicate, continuous, stability, batch, and genealogy data). This ensured that no context was lost, regardless of the original data source, even when taken from paper records and spreadsheets (Figure 1). The number and type of metadata could come from different sources. A typical analytical result is linked to a specific analytical method, method component, equipment, etc., as appropriate. Materials will be linked to a supplier, grade, etc., as appropriate. To allow easy data aggregation, we defined a structure in which all data could be loaded and retrieved by querying its metadata. Tables always refer to a manufacturing or clinical unitary item (e.g., batch number or patient identification code).
- 1US Food and Drug Administration. Guidance for Industry. “Process Validation: General Principles and Practices.” January 2011. http://www.fda.gov/downloads/Drugs/Guidances/UCM070336.pdf
- 2Shashilov, V., and J. Neway. “Traditional Lot Traceability Approaches Are Not Sufficient to Enable Upstream/Downstream Correlation Analysis for Quality by Design (QbD).” Pharmaceutical Engineering 32, No. 5 (2012).
Five tables in the database were constructed to ameliorate simultaneous searches by different users:
- Discrete: Unique single-instance measurements (e.g., patient age, batch manufacturing date)
- Replicate: Single unit in a series of repeated measurements (e.g., injection dates for one patient)
- Continuous: Series of measurements that relate to a single batch of product (e.g., time-based pH profile during the batch manufacturing process)
- Stability: Single unit in a series of measurements over time and conditions (e.g., change in aggregate levels of the active ingredient in a biopharmaceutical over the duration of a stability study)
- Genealogy: Linked inputs and outputs of processed materials over a sequence of process steps (e.g., upstream drug substance lots that contributed to one batch of downstream drug product)
This approach preserved the links between data values and metadata across the organizing principle, and enabled users to trace lots used in the clinic to individual vials from the working cell bank.
Meaningful conclusions and correlations cannot be drawn from data without being able to account for the genealogy of the process stream. Using automated genealogy-mapping tools provided in the same commercially available software system as used above, we linked up- and downstream critical process parameters to product-critical quality attributes in processes where drug product splitting and pooling occurred.
Data sets were in both electronic and hard copy form. Hard copy historical CMC data (usually from a CMO) was transcribed, double-checked to verify correctness, and entered into an electronic database using the browser-based data entry capability also provided in the same commercially available software system used above.
The single data repository was disconnected from the original data source and data-processing applications. Metadata was perpetuated in a data integration layer so it could be extracted, saved, and shared through self-service access without affecting the original source data. This created a plug-and-play system that generated queries and process algorithms automatically.
With the tools and methodology in place, CMC/technical data analyses were conducted independently from the clinical trial process. These were separate from and did not interfere with clinical data processing, since all analyses were conducted in the absence of any clinical data.
To verify data linkages, clinical data sets also included a dictionary to define each parameter for which a measure was reported. We used process modeling and data organization tools to determine correlations between process conditions, product characteristics, and clinical results. Clinical data sets included: 1) information related to the product used (finished goods), such as kit numbers and use dates, and 2) information related to individual patients, such as identification codes and recruitment dates.
In many companies, CMC/technical and clinical teams operate independently of each other due to their different experiences, expectations, locations, business objectives, and key performance indicators. Our methodology was designed to link the two data families and help the teams work together. It also enabled an integrated data analysis that included the process genealogy, tracing back to early drug production process steps from individual kits of clinical trial material. A single active drug product batch, for instance, could generate up to 1,000 product kits for clinical use, and each patient could be exposed to up to four different product kits over multiple visits.
Product process performance is typically evaluated by measuring outputs such as process yield, product purity, and cycle times. In this study, clinical outcomes were the major outputs. Nevertheless, the same mathematical, statistical concepts, or information technology systems and tools were used to analyze process outputs in this different paradigm.
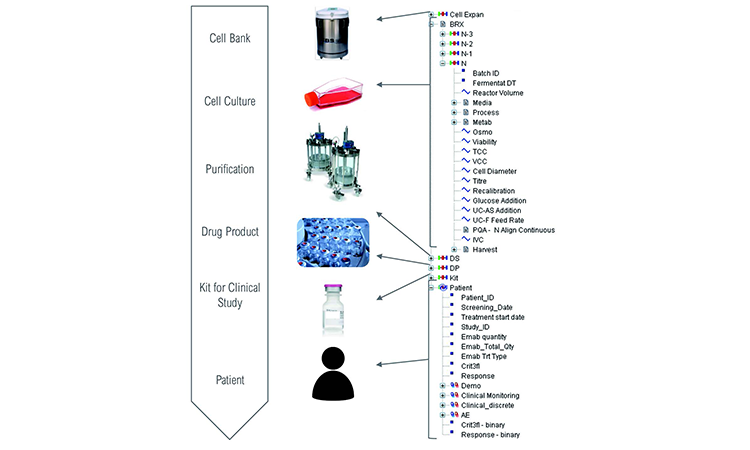
Figure 2 illustrates the complexity of the material genealogy over the process manufacturing steps from raw materials to patient responses, as well as the data model organization used for this study. It appears for an end-user as an activity-based organized data map, ensuring an easy-to-use interface. The process data model configuration enabled analysis across process set-up, production process operations, in-process controls, materials genealogy, product stability, product release, clinical observation, adverse events (AEs), and product/patient linkage (as genealogy).
To enable correlation of multistep manufacturing processes and clinical data, complete traceability across process steps is required. Our platform was configured to analyze each material transaction individually as a single parent-child couple, allowing fast data retrieval and analysis by branch-and-leaf-type filtering as a specific parent or child category. In addition, it removed recycling processes that often create endless query loops and generate lengthy retrieval times.
Each type of transaction has a unique genealogy table. Filtering batch metadata (steps, product name, or number) links successive steps.
| Linked steps | Genealogy origin | Genealogy links | Cardinality |
|---|---|---|---|
| Cell expansion/N-3 N-3/N-2 N-2/N-1 N-1/N N/API |
Excel (in lab) and paper batch record (in mfg) | Batch number to batch number | From 1:1 to 1:10 (between steps N-1 and N) |
| API/bulk drug product | Electronic records (internal mfg) | Batch number to batch number | 1:1.6 (average) |
| Bulk drug product/kit | Excel records | Batch number to kit number | 1:1,000 |
| Kit/patient | Excel records | Kit number to patient identification number | 4:1 |
Understanding the CMC data connection to clinical data
Clinical populations were divided into groups according to treatment outcomes:
- Responders to treatment:
- Yes: A positive response to treatment
- No: A negative response to treatment
- Patients who stayed for the duration of the clinical study:
- Yes: The patient completed the clinical study
- No: The treatment was stopped. (Note that a patient not completing a treatment is automatically considered a negatively responder.)
- Adverse event: The number of AEs in different classes:
- None
- Limited number (1–5)
- Significant number (> 6)
Note: Certain specific AEs (e.g., rashes) and clinical measures (e.g., C-reactive protein) were checked but not reported in this study.
To correlate physical parameters in the patient population, we determined quality attributes that influenced clinical observations and later specification limits by performing the following process data analyses:
- Parameter characterization and distribution description: Provides basic descriptive statistics and shape analyses
- Unifactorial correlation verification: Checks whether an input parameter influenced an output parameter (e.g., analysis of variance), correlation matrix, nonparametric tests, dimension reduction: principle component analysis with selection of the most influential parameters
- Multiple regression: Uses a list of selected input parameters in a stepwise multifactorial regression. Stepwise procedures alternatively include and exclude parameters to retain only influencing parameters and quantify parameter influences.
Results
Critical quality attributes
To define the product quality profile, we estimated the evolution of quality attributes between the dates of drug manufacture and drug administration, then correlated the model of the quality profile with clinical outcomes. This approach provided a more realistic assessment of the effect of individual quality attributes on treatment efficacy.
A stability model for each quality attribute was used to predict its evolution until the time of administration to the patient. Constant and correct storage conditions (5°C) were used to determine the predicted value.
Stability studies performed on drug substance and drug product (at –70°C, +5°C, +25°C, and +40°C) identified three types of relationships between measured values evaluated during product testing and at the estimated time of administration to patients (Table B):
| Stability outcome | Relationship equation |
|---|---|
| No evolution | Yinj = Ymfg |
| Linear evolution | Yinj = A + B.Ymfg × time |
| Nonlinear evolution | Yinj = B.f(time, Ymfg) |
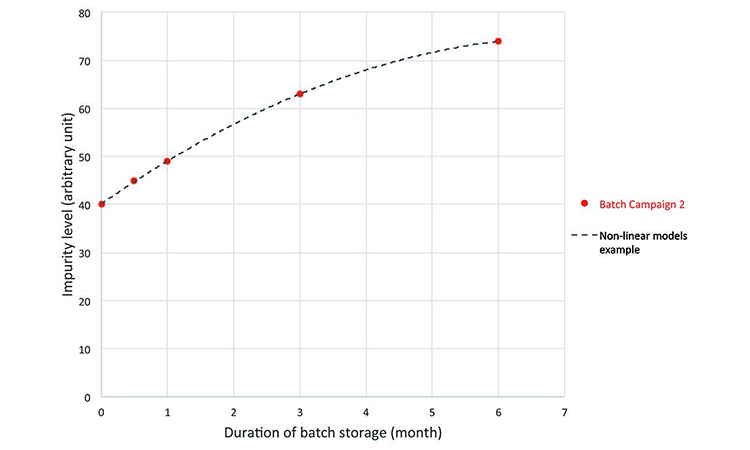
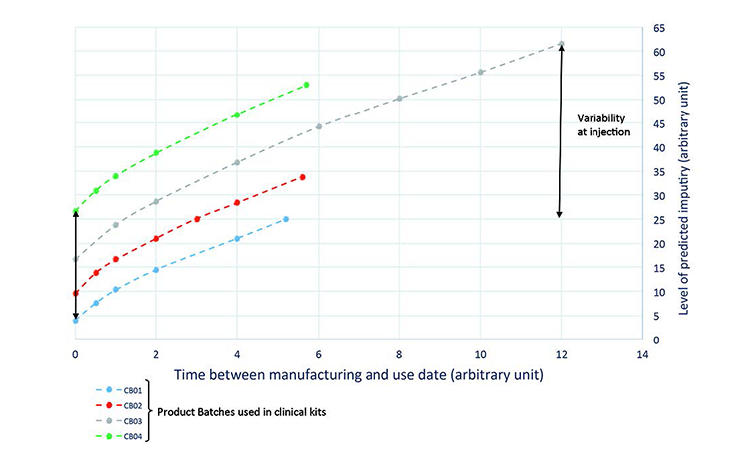
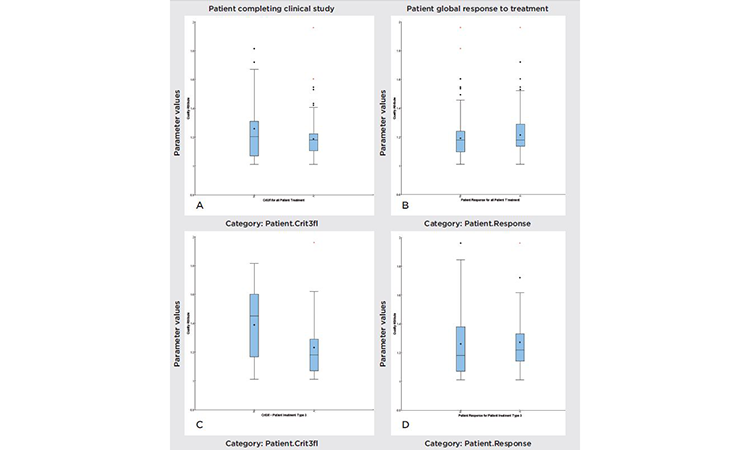
Prediction: The real-time evolution of specific impurities during product storage (Figure 3) were used to develop the process model, which was then used to predict a quality profile of the clinical material on the date of drug intake (Figure 4). This was achieved by combining the date of drug manufacture, the impurity profile at release time, and the evolution of the impurity profile measured during stability studies. This model was used to predict the quality profile on the date of patient administration for individual kits after a variable period of storage from manufacturing to patient administration. Quality attributes were assessed as a function of three criteria:
- Individual patient treatment response
- Patients remaining for the study duration
- Adverse events: Scoring the number of AEs in different classes
To investigate relationships between clinical responses (e.g., AEs, responders, and nonresponders), we looked at the total patient population, the population that completed clinical trials, dosage, and quality parameter values. Figure 5 compares the variability of a specific parameter value, under different conditions. The figure can be divided into two groups: “Patient global response to treatment” (A and C) and “Patient completing clinical study” (B and D). Variation analyses were performed for all treatment types (A and B), with doses of active pharmaceutical ingredient (API)ranging from 100 to 1,800 milligrams (mg), and for treatment type 3, which corresponds to a 1,200-mg dose (C and D). Observation of these subgroups removes an important source of variability, but also decreases the statistical significance of the study.
To analyze this correlation, we used multiple tools, such as:
- Box and whisker plot: Evaluates the different distributions of quality attributes between groups
- Regressions: Evaluate quality attributes that influence clinical measurements. The variability range of each quality attribute showed no correlation between responder and nonresponder patients, or between patients who completed the treatment and those who left the study.
Using a formal statistical approach, we concluded that there was a statistical difference between those patients who left and those patients who completed the type 3 treatment (1,200 mg API, P value = 0.04). However, the size of the subgroup (patients receiving treatment type 3 and leaving the trial) was limited, and the observed statistical difference was not significant.
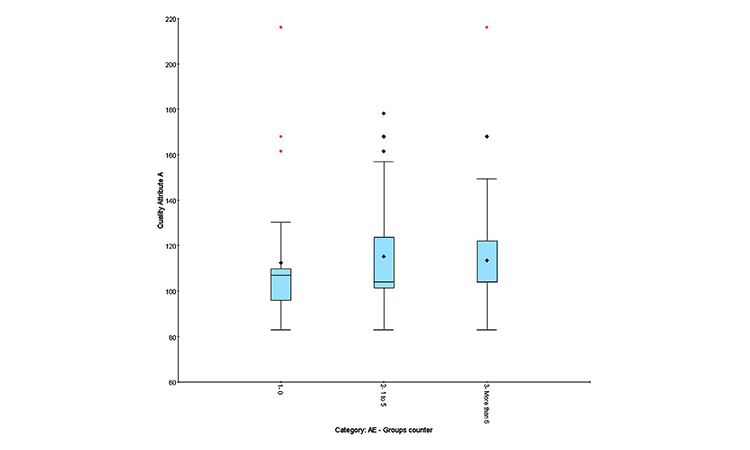
Quality profile effect on AEs
Clinical results can be expressed in different ways:
- Quantitative: Number of AEs observed in an individual patient attributed to treatment
- Qualitative: “Yes” if AEs observed, “No” if no AEs observed
- Semiquantitative: Number of AEs observed during treatment (0, 1–5, or > 6)
The semiquantitative method distinguishes group effects better than numerical correlation and is recommended to highlight adverse events and identify group homogeneity.
To analyze this correlation, we used statistical tools.
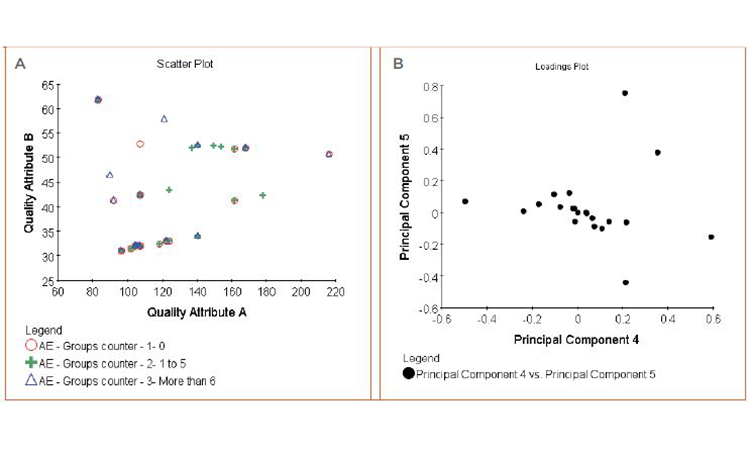
• Figure 7A: Box-and-whisker plot and cluster analysis on the quality attributes to evaluate the distribution differences between qualitative and semiquantitative groups (patient responses, patient leavers, AEs) (Figures 5 and 6)
• Figure 7B: Principal component analysis multifactorial regression on the quality attributes and combination of quality attributes to measure their impact on quantitative factors (frequency of adverse event, biological measures)
Neither analysis showed any correlation between quality attributes and clinical observations.
We were unable to isolate quality attributes as influencing clinical observations for either efficacy indicators or adverse events.
Conclusions
The objective of this pilot study was to develop an approach to understanding relationships between product quality attributes and clinical patient outcomes. A carefully designed data architecture was combined with a commercial software system for fully integrated data access, aggregation, contextualization, analysis, and reporting to assess possible links between clinical outcomes and manufacturing process data.
By following this approach we were able to evaluate relationships between quality and clinical metrics (single or combined) more easily, as compared to the manual methods used in the past.
No significant correlation was found between product quality attributes and clinical outcome of the drug product in terms of treatment efficacy, treatment tolerance, or AEs. The value of this result represents (to the best of our knowledge) the first published instance of such a demonstration.
This study used software systems instead of manual data aggregation and contextualization methods, dramatically reducing the potential for human error. It provided systematic analysis for 10 to 1,000 batches. The knowledge gained can easily be leveraged and connected with other sets of data.
Making the link between manufacturing process and product quality data and patient outcomes was the most important step forward, since lower patient risk translates to lower costs and faster times to market for new drugs.
We believe that the processes and tools described in this study offer a useful path to link the quality of manufactured product to improved treatment safety and efficacy that will improve the data-driven determination of critical quality attributes and their relationship to meaningful clinical qualification of specifications.
The process of progressing a pharmaceutical product from clinical trials to successful launch and delivering consistent product to the patient requires analysis and understanding of vast amounts of data. Analyzing of such large data sets (commonly referred to as “big data”) is often a complex and arduous way to demonstrate that a pharmaceutical product meets expected standards of quality, safety, and efficacy.
Establishing data-driven quality specifications (product and process limits) based on scientific understanding of the pharmaceutical, its stability, characteristics, and manufacturing capability is reasonably straightforward. Linking product quality metrics to safety and efficacy data, however, is still not typically a facile endeavor. Advances in “big data” methods, as shown in this study, offer the potential of achieving science-based clinical qualification of specifications.