Evaluating In-line Volume Reduction During mAb Production

In-line concentration solves problems found in mAb production, including insufficient storage capacity and process tank volumes, extended processing times, and large hold-up loop volumes for ultrafiltration concentration. It optimizes the ion-exchange step following capture, reduces costs and processing times for virus filtration and polishing, and significantly improves the ultrafiltration/defiltration yield, all without large hardware investments.
Biopharmaceutical manufacturers are under pressure to reduce costs and increase the robustness and flexibility of their manufacturing operations. Optimization of downstream purification steps is required to achieve these goals. In-line concentration of dilute solutions prior to various downstream unit operations can result in both cost and time efficiencies.
The use of single-pass tangential flow filtration (SPTFF) technology to cope with commonly found monoclonal antibody (mAb) production challenges has been previously reported.1–3 SPTFF systems employ flow ratio control, which insures a fixed ratio between feed and retentate flows.
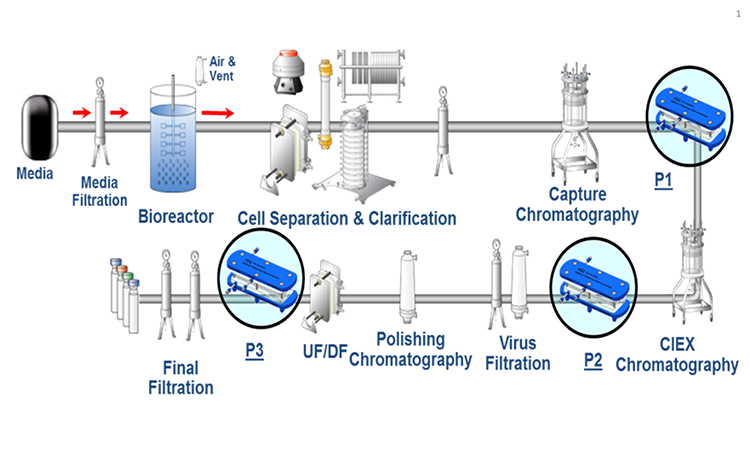
This study investigated the performance and scale-up possibilities for in-line concentration on a mAb production platform using a patented SPTFF technology approach designed by Pall Life Sciences for a simplified control scheme with a fixed retentate resistor (Figure 1). The study was built on behalf of Novo Nordisk.
Materials And Methods
Setup
This study was conducted using an in-line concentration module with a 30-kilodalton (kDa) Delta-regenerated cellulose membrane. This holder-less preassembled device, based on new SPTFF technology, is equipped with a built-in fixed retentate resistor that supplies a set backpressure to the retentate side, achieving a target volumetric concentration factor (VCF) of 2x–5x or higher.4 All that is needed to operate the system is a feed-pressure source (i.e., pump or pressurized vessel) and a feed pressure-measurement device. The staged flow path is a series-and-parallel arrangement of T-series cassettes in a 3-2-1-1 configuration, referred to as “four in series.”
The effective total area of the membrane was 0.065 square meters (m2). The system was equipped with a Quattroflow 150S pump and three Pendotech PrePS-N-000 pressure sensors.
Methods
Three experiments were performed:
- Volume reduction after the capture column (P1)
- Volume reduction before virus filtration (P2)
- Final ultrafiltration (UF) concentration after ultrafiltration/defiltration (UF/DF) (P3)
The same module was used for each test after cleaning with 0.3 M sodium hydroxide (NaOH) at room temperature. Normalized water permeability was measured before and after each session; observed data indicated that no significant fouling occurred and that the cleaning was effective. The module was equilibrated with respective buffer before each test.
To determine the capability of in-line concentration for each process step, feed-flow excursions at different feed concentrations were conducted while monitoring the VCF, retentate and permeate flows, and mAb concentrations. During these tests, the system was placed in total recirculation mode for the product. Feed flow was adjusted using the pump speed controller. The permeate, retentate, and feed flows were assessed using a scale with a stopwatch. A relative density of 1 gram per milliliter (g/mL) was applied to convert the gravimetric data to volume values. The feed and retentate concentrations were measured using a NanoDrop 2000c full-spectrum ultraviolet-visible (UV-Vis) spectrophotometer and the appropriate assay. Full single-pass operation was also evaluated for the volume reduction before the virus filtration (P2) and the final concentration after UF/DF (P3).
In addition, the effect of sample conductivity on concentration performance was investigated for volume reduction after the capture column (P1). It was expected that a higher salt concentration would increase the protein solubility and thus enhance ultrafiltration (UF) mass transfer, leading to improved ultrafiltration performance.
The pool sample from the capture step was mixed with salt (NaCl) to obtain a final concentration of 150 millimolar (mM) to increase the conductivity to 20.0 milli-Siemens per centimeter (mS/cm), and the pool sample from the cation exchange was diafiltrated with water for injection (WFI) until a conductivity of 1.9 mS/cm was achieved.
- 4Casey, C., and E. Ayturk. “Volume Reduction and Process Optimization with Cadence Single-Use Inline Concentrator.” Pall Life Sciences Application Note USTR 2913. https://shop.pall.com/INTERSHOP/web/WFS/PALL-PALLUS-Site/en_US/-/USD/ViewProductAttachment-OpenFile?LocaleId=&DirectoryPath=pdfs%2FBiopharmaceuticals&FileName=14.9558_USTR2913a_Vol_Re-duc_Cadence_ILC_AN.pdf&UnitName=PALL
In-line Volume Reduction After mAb Capture
The capability of in-line concentration to reduce the process volume after the capture step was investigated by Novo Nordisk because the company wanted to increase its storage capacity; a volume reduction of at least 3x was required to do so. Volumetric reduction just prior to the ion-exchange step was expected to optimize this step with shorter process times and/or reduced column volumes, both of which have the potential to reduce production costs.
Optimization: Feed flux excursions
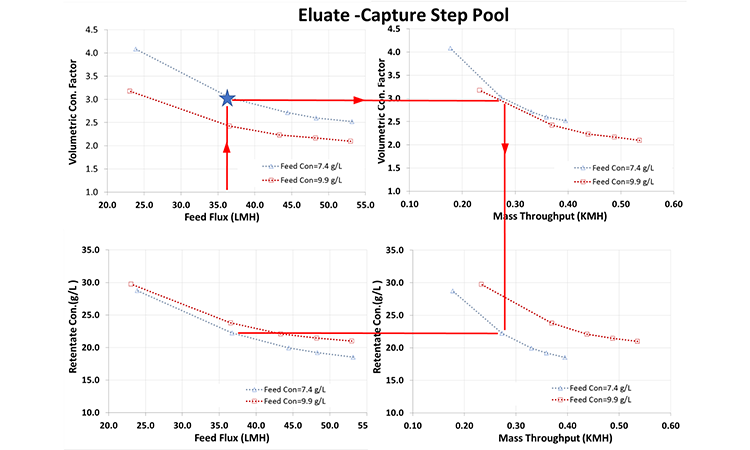
Typically, the capture-step pool has a mAb concentration of approximately 7.0 grams per liter (g/L) and a conductivity of 3 mS/cm. Optimization studies were performed at mAb concentrations of 7.4 g/L and 9.9 g/L (Figure 2). A volumetric concentration factor of 3x was achieved at a feed flux of 36.7 L per square meter per hour (LMH), corresponding to a mass throughput of 0.27 kilograms per square meter per hour (KMH).
Notably, nearly the same retentate concentration was obtained even at a higher feed concentration at the same feed flux. Retentate concentrations of 22.2 g/L and 23.8 g/L, respectively, were obtained for mAb concentrations of 7.4 g/L and of 9.9 g/L at a feed flux of 36 LMH. In addition, the same VCF was achieved for the highest feed concentration when the same mass throughput was used.
These results suggest that controlling in-line concentration with the feed flux provides robust dampening for small variations in feed concentration while yielding similar retentate concentrations. If the objective is to obtain similar VCF values, however, the feed concentration and the mass throughput should be considered. Feed flux was calculated by adding the permeate and retentate flows, then dividing the sum by the module area. VCF was calculated by dividing the feed flux by the retentate flux. Retentate concentration was determined by sampling the retentate stream and measuring the concentration using a full-spectrum UV-Vis spectrophotometer. The average of five samples taken during the optimization step was used for the feed concentration. Mass throughput was calculated by multiplying the feed flux by the average feed concentration. Importantly, retentate concentrations of the product stream calculated for each set point based on the VCF were in good agreement with the measured values.
Effect of feed sample conductivity on flux
Typically, the eluate pool of the capture step has a very low salt concentration and consequently a low conductivity (2.9 mS/cm for the sample used in this study). Because salt increases mAb solubility, it may also affect protein concentration at the membrane surface. A decrease in the concentration polarization boundary layer thickness improves the ultrafiltration mass transfer coeffcient.6 A single-pass concentration step, operating primarily in the mass-transfer-controlled region where the permeate flux is independent of the pressure,1 ,2 improves mass transfer and can result in higher permeate flux and an improved capacity for concentration.
To demonstrate the effect of improved solubility and to increase the mass transfer, the capture step pool conductivity was adjusted to 20 mS/cm by adding NaCl to achieve a concentration of 150 mM. For a mAb solution containing 150 mM NaCl, a feed flux of approximately 36 LMH provided a VCF of nearly 5.5x. The eluate pool without salt achieved a VCF of 2.5x at the same feed flux.
Possible aggregate formation caused by microcavitation induced by pumps and valves during product concentration was also investigated. Aggregate formation may be increased due to multiple passes in conventional tangential flow filtration (TFF).3 Samples were collected during the process and analyzedvia size-exclusive high-performance liquid chromatography for high-molecular-weight protein (HMWP) content. No increase in HMWP content was observed after concentration of capture pool samples with and without salt.
- 6Sablani, S. S., M. F. Goosen, R. Al-Belushi, and M. Wilf. “Concentration Polarization in Ultra-filtration and Reverse Osmosis: A Critical Review.” Desalination 141, issue 3 (2001): 269-289.
- 1Casey, C., T. Gallos, Y. Alekseev, E. Ayturk, and S. Pearl. “Protein Concentration with Single-Pass Tangential Flow Filtration.” Journal of Membrane Science 384, nos. 1-2 (November 2011): 82-88.
- 2Pall Life Sciences. “Cadence Systems Employ New Single-Pass TFF Technology to Simplify Processes and Lower Costs.” Application Note USD2789. http://www.selectscience.net/downloads/articles/3386_11-4802_CadenceSystem_USD2789_AN.pdf
- 3Van Reis, R., and A. Zydney. 2007. “Bioprocess Membrane Technology.” Journal of Membrane Science 297, nos. 1-2 (5 July 2007): 16-50.
Scale-up to pilot scale
Using the results obtained for the feed-flux excursion experiments, throughputs and feed fluxes required to obtain desired VCF and retentate concentrations were calculated for volume reduction of a 200-L chromatographic capture step pool with a concentration of 7.4 g/L. It was found that this volume could be reduced in 1.6 to 2.5 hours using an in-line concentration module with an effective filter area of 3.5 m2. In-line concentration also increases freezing storage capacity and creates opportunities to optimize the subsequent cation-exchange step without the need for a large hardware investment.
In-line Volume Reduction Before Virus Filtration
Virus filtration is costly and time-consuming for mAb production. In addition, the conductivity of the chromatographic pool after the ion exchange is often too high and must be diluted three times before the polishing chromatography step. The reductions in filter area and processing times possible with smaller filtration volumes reduce operating costs, not only during virus filtration but also in the chromatographic polishing step.
Optimization: Feed flux excursions
The ion-exchanger step pool had a product concentration of approximately 10 g/L and a conductivity of 16 mS/cm. To test the in-line concentration capabilities and process robustness, feed-flux excursions at three different pool concentrations (8.4, 10.4, and 12.1 g/L) were evaluated. For a product pool concentration of 10.4 g/L, a VCF of 3x was achieved using a feed flux of 57 LMH and a throughput of 0.59 KMH, approximately twice that observed for the capture step pool. The higher throughput can be explained by the higher conductivity of the ion-exchange pool.
As was the case for concentration of the capture step pool, nearly the same retentate concentrations were obtained for different feed concentrations (8.4 and 10.4 g/L) at the same feed flux. This finding provides further evidence that in-line concentration control by the feed flux provides robust dampening for small variations in feed concentration. Nearly the same VCF was achieved for all concentrations when the same mass throughput was used, however.
Single-pass run and product recovery
Next, a single-pass run was conducted with a feed flux of 57 LMH, using the ion-exchange pool with a starting concentration of 11 g/L to evaluate the stability of the in-line concentration process and determine the product recovery. Stable filtration without fouling was observed. Product recoveries of approximately 99.6% and 98.9% were obtained with and without (three hold-up volumes) system flushing, respectively.
Effect of decreased feed sample conductivity on flux
Although the same mAb was used, the mass throughput for the ion-exchange pool was nearly twice that of the capture step pool using a higher feed concentration. The main difference was the pool conductivity. To demonstrate that a higher pool conductivity (16 mS/cm) allows for a greater concentration factor, an additional test was performed using a product pool diafiltrated with WFI to a conductivity of 1.6 mS/cm. In this study’s experimental setup, in-line concentration produced a sample with lower conductivity.
With the diafiltrated sample (1.6 mS/cm), similar VCFs were obtained with a significant decrease in the mass throughput compared with the higher conductivity sample. In fact, it was not possible to achieve a VCF of 3x for the 1.6 mS/cm sample, even at a significantly lower feed flux. This can be explained by a decrease in mAb solubility at lower conductivity. Lower mAb solubility may lead to a higher protein concentration at the membrane surface, possibly increasing the concentration polarization layer thickness and decreasing the UF mass-transfer coefficient. Using an in-line concentration module with a single-pass concentration step that operates largely in the mass-transfer-controlled region (where the permeate flux is independent of the pressure) decreases the mass-transfer coefficient and can therefore decrease the permeate flow, limiting the VCF that can be achieved.
Scale-up to pilot scale
Virus filtration and polishing chromatography are intended to remove contaminants. Optimal impurity binding on the polishing chromatography column exchanger requires a decreased pool conductivity, which is achieved via 3x dilution. To maintain the same volume for both chromatography steps, 3x volumetric reduction of the ion-exchange pool was targeted.
Expected throughputs and feed fluxes required to obtain the desired VCF and retentate concentrations for volume reduction of a 200-L ion-exchange pool (10.4 g/L) were calculated using results obtained for the feed-flux excursion experiments. This volume could be reduced by a factor of three within 5 hours using one module with a filtration area of 0.7 m2, or 1 hour using a module with a filtration area of 3.5 m2.
In-line Volume Reduction And UF/DF
For final concentration, Novo Nordisk may currently perform up to three steps on the same UF system. The mAb is first concentrated to approximately 50 g/L, then diafiltrated with a suitable solution, and finally concentrated to > 100 g/L. A standard pilot UF system processes initial volumes from 600 L and provides final volumes of 12 to 15 L (VCF 40–50x). Such volume constraints may lead to poor product recovery and low yields, requiring product over-concentration.
The ability of this in-line concentration process to reach a mAb concentration > 100 g/L in the final concentration step (after initial concentration and defiltration (DF) on the existing UF system) was evaluated. The goal was to achieve a significantly increased product yield.
Optimization: Feed flux excursions
Feed flux excursions at feed concentrations of 49.4 g/L and at 59.2 g/L were conducted. The samples were previously concentrated and diafiltrated using a suitable buffer solution on the existing UF system. The feed flux, VCF, feed concentration, retentate concentration, and mass throughput were calculated or determined as described for the capture step.
For the two feed materials (of around 49 and at 59 g/L), the target retentate concentration was achieved at respective feed fluxes of 20 and 20.9 LMH. Once again, controlling in-line concentration via the feed flux provided robust dampening for small variations in the feed concentration (±10%).
Single-pass run and product recovery
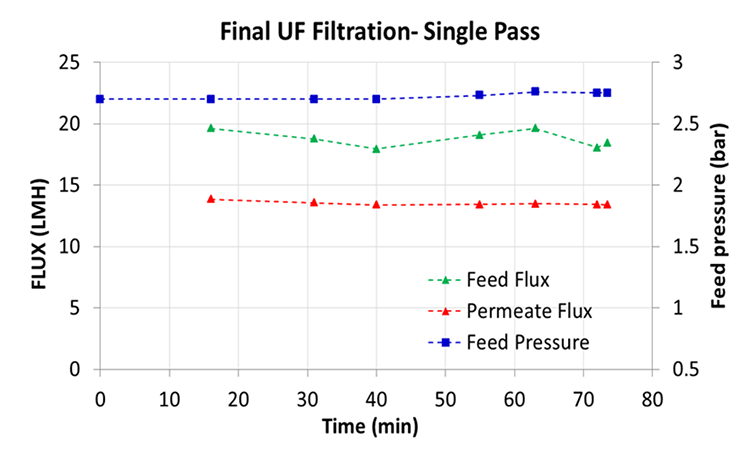
A single-pass run was performed using a feed concentration of 50 g/L and a total volume of 1.51 L with a 0.065 m2 module to test the stability of the in-line concentration module and determine the product recovery (Figure 3). Single-pass operation was stable without any indication of permeate flux decreases or feed-pressure increases during the 75-minute run, indicating no membrane fouling.
A product recovery of 96.7% was obtained after flushing with an equivalent of two-system hold-up volumes—a significant yield improvement when compared with the current process.
Scale-up to pilot scale
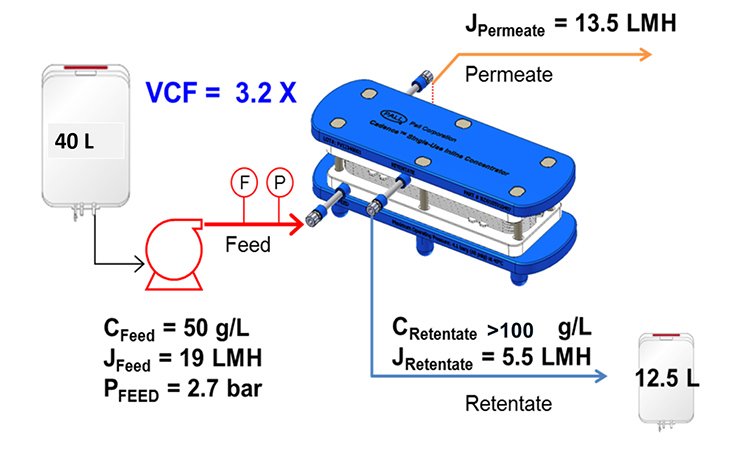
Based on the test data from the single-pass run at a concentration of 49.6 g/L, the filter area for processing a batch volume of 40 L with a mAb concentration of approximately 50 g/L to a final concentration of > 100 g/L was calculated to take 3 hours using an in-line concentration module with a 0.7 m2 membrane area—a potential improvement of the final UF yield compared to a conventional TFF system (Figure 4).5
Conclusions
For the tested mAb, the in-line concentration process performed in the present study reduced the capture step pool volume by a factor of 3x or 4x at respective feed fluxes of 36 to 22 LMH, meeting Novo Nordisk’s requirements. To concentrate 200 L of the capture step pool starting from approximately 7.4 to 29.6 g/L within a reasonable processing time, an in-line concentration module with an effective filtration area of 3.5 m2 would be required. The use of single-pass in-line concentration at this stage of the process increases binding capacity and creates an opportunity to optimize the subsequent ion-exchange step without a large hardware investment.
The ion-exchange pool was reduced by a factor of 3x with a feed flux of 57 LMH using in-line concentration, also meeting Novo Nordisk’s requirements. Concentration of the 200-L capture step pool from approximately 10 to 34 g/L can be achieved within 5 hours using an in-line concentration module with an effective filtration area of 0.7 m2 or 1 hour with a larger module (3.5 m2 membrane area). The reduction in volume of the ion-exchange pool may permit cost and processing time reductions in the virus filtration and subsequent polishing chromatography steps.
Notably, the in-line concentration performance of this study’s experimental setup was affected by the conductivity (salt concentration) of the chromatographic pools. At the same feed flux, adding salt to increase the capture step pool conductivity to 20 mS/cm increased retentate concentration to nearly twice that without salt. Conversely, removing the salt from the ion-exchange pool via DF significantly reduced concentration.
For final concentration after the UF/DF step, this study’s in-line process increased a 50 g/L mAb solution to a final concentration of > 100 g/L in a single pass, with continuous concentration at a feed flux of 19 LMH. Processing 40 L with a mAb concentration of 50 g/L would be possible within 3 hours using a single-pass in-line concentration module with a 0.7 m2 membrane area. Following these parameters for the final concentration step can significantly improve the final UF yield when compared with the conventional TFF system.
It was also shown that controlling in-line concentration by the feed flux provides a robust dampening effect for small variations in the feed product concentration. If the processing objective is to obtain a similar retentate concentration, the feed flux should be the controlling parameter. If the aim is to obtain a similar VCF, the feed concentration and the mass throughput should serve as the controls.
For more information, see patents: Mir, L., and G. de los Reyes. “Method and Apparatus for the Filtration of Biological Solutions.” US patents 7,384,549 B2 (fi led 22 December 2006 and issued 10 June 2008), 7,682,511 B2 (23 March 2010), 7,967,987 B2 (28 June 2011) and 8,157,999 B2 (17 April 2012).
- 5Eschbach, Geraldine, and Steve Vermant. “TFF Membranes for High MAb Concentration.” Bioprocess International, 1 November 2008. http://www.bioprocessintl.com/downstream-processing/filtration/t -membranes-for-high-mab-concentration-183386