Statistical Approach for CU Testing CPV Batches & Comparison with USP <905> UDU

The USP <905> UDU test, widely used for batch release since 2007, is no longer supported by FDA. We propose a two-sided tolerance interval method to alleviate this deficiency. The approach provides 50% confidence and 95% probability that future samples from the batch will conform to USP <905> criteria. In addition, this new statistical assessment provides the same practical look and feel as USP <905>.
A compendial test used routinely in pharmaceutical manufacturing, the US Pharmacopeia (USP) <905> uniformity of dosage unit (UDU) test is familiar across the industry. The test is a market benchmark, and its procedure and acceptance criteria have been widely used for batch release since its introduction in 2007, due to its convenient results reporting and ease of determining conformance to acceptance criteria.1 Although used for batch release, the procedures and acceptance criteria in USP <905> do not represent a statistical sampling plan. As such, results derived from these procedures should not be extrapolated to a larger population —such as an entire product batch—due to a lack of statistical assurance that it would meet appropriate specifications and statistical quality control criteria.
As of 2013, the US Food and Drug Administration (FDA) withdrew its support for USP <905> procedures and acceptance criteria for batch release,2 followed by the USP in 2014.3 During continued process verification (CPV), however, there is a need for a statistical batch release testing method to provide reasonable assurance that a released batch will comply with USP <905>.4 Alternative statistical approaches have been published in the literature, 6 suggesting 50% confidence and 95% probability with respect to USP <905>.5 ,6 ,7 No such comparison has been presented for a two-sided tolerance interval option that provides 50% confidence and 95% probability of passing USP <905>. This paper presents such an approach.
Background
The USP <905> content uniformity (CU) test methodology for batch release includes testing of individual doses of finished pharmaceuticals to ensure that the product meets quality specifications.8 Testing starts during manufacturing, when at least 30 dosage units are sampled, usually as a random composite from the batch, and includes up to two stages of analytical testing to determine conformance to USP <905>.
Stage 1 begins with the assay of 10 individual dosage units to determine the amount of active ingredient in each as a percentage of the label claim (%LC). An acceptance value (AV) is then calculated, and if not more than (NMT) 15.0, the batch passes the content uniformity requirement. If the value is greater than 15.0, the testing progresses to Stage 2.
In Stage 2, another 20 units are assayed. Acceptance criteria are an AV of NMT 15.0, and all individual dosage units within determined limits. If results meet the criteria for either stage of testing, the batch passes the USP <905> requirements and is deemed to have demonstrated CU acceptable for release.
STAGE 1
- Assay 10 dosage units.
- Calculate the AV.
| \( AV = |M – \bar x | + 2.4s \) | |
| M | For 98.5 ≤ x̄ ≤ 101.5, M = x̄ For x̄ < 98.5, M = 98.5 For x̄ > 101.5, M = 101.5 |
| x̄ | Average of the 10 assay values |
| s | Sample standard deviation of the 10 assay values |
- If AV is NMT 15.0, the USP <905> testing criteria are met.
STAGE 2
- Assay 20 additional dosage units.
- Calculate the AV.
| \( AV=|M – \bar x | + 2.0s \) | |
| M | For 98.5 ≤ x̄ ≤101.5, M = x̄ For x̄ < 98.5, M = 98.5 For x̄ >101.5, M = 101.5 |
| x̄ | Average of the 30 assay values |
| s | Sample standard deviation of the 30 assay values |
- Calculate the limits for the individual dosage unit assays. The low limit for each individual assay is (0.75 M) and the high limit for each individual assay is (1.25 M).
- If all assays are between (0.75 M) and (1.25 M) and the AV is NMT 15.0, the USP <905> testing criteria are met.
Multiple statistical approaches have been proposed as replacements for the procedures and acceptance criteria currently defined by USP <905>. While these approaches satisfy the statistical shortcomings of USP <905>, they require significant deviation from the current familiar implementation of that compendial test, such as comparing test results against large, table-listed acceptance limits (ASTM E2709/E2819), or determining acceptance by applying one- and two-sided tolerance intervals to the test results. 5 Both approaches require mathematical manipulation of the test results followed by individual determination of conformance to the acceptance limits.
To overcome obstacles associated with industry acceptance of a statistical methodology that may be unfamiliar, we attempted to develop a method that provides adequate statistical assurance in a manner that has the same familiar look and feel of the acceptance criteria test associated with USP <905>. The process presented here results in a single number that, when maintained within the defined numerical limit, satisfies the minimum statistical assurance provided by the acceptance criteria, a process very similar to that of the current application of USP <905>.
The CU approach presented here was selected and developed for two reasons: First, 50% confidence, 95% probability to pass USP <905> has been suggested as appropriate for release testing. Second, the methodology was developed to have the same practical look and feel as the current application of USP <905>.
Derivation
In this document, the percentage of individual CU results falling between 85.0 and 115.0 %LC is defined as “coverage.” It has been shown that there is at least a 95% probability of passing the USP <905> test if coverage is at least 98.58%. 5 Based on this, a statistical approach to assess CU for batch release using a two-sided tolerance interval approach to provide 50% confidence and 95% probability to pass USP <905> (two-sided 50/95 UDU test), was established.
First, a two-sided tolerance interval is calculated:
$$Lower\,Limit (LL) = \bar X – k \times SD \label{eq1} \tag{1})$$
$$Lower\,Limit (UL) = \bar X – k \times SD \label{eq2} \tag{2} $$
where \( \bar X \) is the mean of individual contents (expressed as %LC), SD is the sample standard deviation (expressed as %LC), and k is a constant that imparts the specified confidence level, coverage (corresponding with the probability to pass USP <905>), and sample size.
The constant k is calculated using the following equation:9
$$k = z_{\frac{1+p}{2}}\sqrt{ \frac{v( 1 + \frac{1}{n})}{x^2_{v;1-y}} (1 + \frac{(n-3)-x^2_{v;1-y}}{2(n+1)^2})} \label{eq3} \tag{3}$$
where:
- z is the critical value of the normal distribution associated with cumulative probability (1 + p)/
- p is the probability of individual values to fall within the range (coverage).
- n is the sample size (number of dosage units in a sample).
- v is the degrees of freedom (n – 1).
- γ is the confidence level (frequency with which the tolerance interval will contain the targeted number of individual values within the range (coverage)).
- $$x^2_{v;1-y}$$ is the critical value of the chi-square distribution with degrees of freedom (v) exceeded with confidence level (γ).
Secondly, a determination must be made whether a CU sample passes the acceptance criteria. As expressed in Equations (4) and (5), the sample passes the acceptance criteria only if the interval (LL to UL) is completely contained within 85 to 115 %LC.
$$85.0 \leq LL = \bar x – k \times SD \label{eq4} \tag{4}$$
$$115.0 \geq UL = \bar x + k \times SD \label{eq5} \tag{5}$$
For \( \bar X \leq 100.0 \) the condition in Equation (\ref{eq5}) can be met if the condition in Equation (\ref{eq4}) can be met. Equation (\ref{eq5}) can then be derived as:
$$\begin{align} 100.0 – 85.0 \geq 100.0 – LL &= 100.0 – ( \bar x – k \times SD) \\ &= 100.0 – \bar x + k \times SD \\ &= | 100.0 – \bar x | + k \times SD \end{align} \tag{8} $$
Which can be further derived as:
$$| 100.0 – x ̂| + k \times SD \leq 15.0 \tag{7}$$
For \bar x \geq 100.0, the condition in Equation (\ref{eq4}) can be met if the condition in Equation (\ref{eq5}) can be met. Equation (\ref{eq5}) can then be derived as:
$$\begin{align} 115.0 – 100.0 \geq – 100.0 &= (\bar x + k \times SD) – 100.0 \\ &= \bar x – 100.0 + k \times SD \\ &= | 100.0 – \bar x | + k \times SD \end{align} \tag{8}$$
Which can be further derived as:
$$| 100.0 – \bar x | + k \times SD \leq 15.0 \tag{9}$$
Based on these results, it is concluded that |100.0 – x̄| + k × SD should be NMT 15.0 to ensure the sample passes the release requirement. As such, x ̂|100.0 – | + k × SD is defined as the AV. Using this equation, an AV value can be established that satisfies any desired confidence (γ) and coverage (p) by calculating the corresponding k value using equation (3).
From the ISPE-sponsored Blend Uniformity and Content Uniformity Group’s recommendation,10 the proposed CU testing for CPV batches should consist of two stages (10 dosage units for Stage 1 and 30 dosage units for Stage 2). Additionally, a 50% confidence level and 98.58% coverage (corresponding to 95% probability to pass USP <905> test)5 has been proposed as appropriate for release testing.6 Therefore, to meet these recommendations using Equation (3), the corresponding k values for sample sizes of 10 and 30 are 2.664 and 2.521, respectively. As such, |100.0 – x̄| + k × SD is defined as the two-sided 50/95 UDU test, for which an AV of NMT 15 ensures 50% confidence, 95% probability (AV50/95), when k = 2.664 (n = 10), and when k = 2.521 (n = 30).
Application
A stepwise summary of the proposed commercial testing procedure and application of the CU criteria for CPV is:
- During manufacturing, collect at least one sample from at least 30 locations spaced equally across the batch, including the beginning and end of the run.
- Assay a total of 10 dosage units from approximately equal locations across the batch, including the beginning and end of run. These samples should be taken from the 30 samples collected during manufacturing.
- Calculate the average (x̄) and SD of the 10 results.
- Calculate AV50/95 = |100.0 – x̄ | + 2.664 × SD
- The sample complies if all individual values are within 75.0–125.0 %LC and AV50/95 ≤ 15.0.
- If AV50/95 > 15.0, assay 20 additional dosage units (one dosage unit from each of the remaining locations collected during manufacturing).
- Calculate the average (x̄) and SD of the 30 total results
- Calculate AV(50/95) = |100.0 – x̄ |+2.521 × SD.
- The sample complies if all values are within 75.0–125.0 %LC and AV50/95 ≤ 15.0.
- If AV50/95 > 15.0, the batch does not meet the acceptance criteria.
- CU acceptance criteria are summarized in Table A. If the acceptance criteria
- can be met, then with 50% confidence, there is at least 95% probability
- samples from the lot will pass the USP <905> UDU test.
| CU Acceptance Criteria for two-sided 50/95 UDU | |
|---|---|
| Stage 1 |
|
| Stage 2 |
|
| Confidence level = 50%, Probability (passing USP <905> UDU) = 95% | |
Comparison
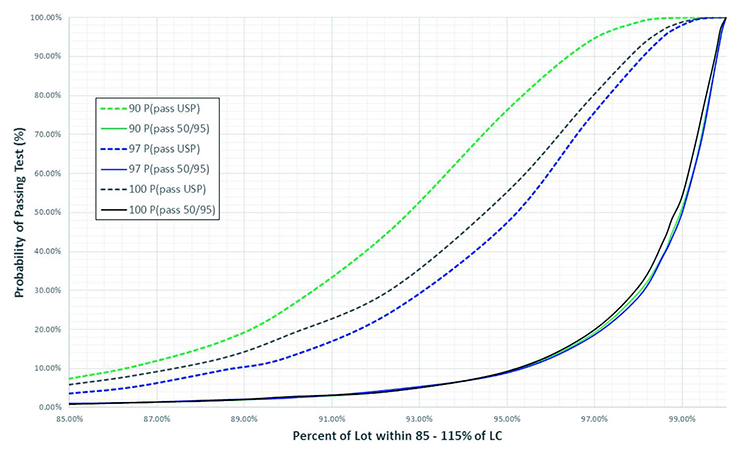
As shown in Figure 1 (10,000 simulations), the probability of passing the USP UDU at any given coverage changes as the lot mean changes (e.g., 90, 97, and 100 %LC). This has been demonstrated previously by Bergum 5 and is a function of the “indifference zone” in USP <905> UDU, which introduces bias in acceptance probability when the lot mean deviates from 100 %LC.11 As can also be seen in Figure 1, the phenomenon created by the indifference zone is absent in the operating characteristic (OC) curves created using the two-sided 50/95 UDU test. (This is expected since the methodology does not incorporate an indifference zone.) Also apparent in Figure 1 is the relatively conservative nature of the two-sided 50/95 UDU test compared to USP <905>. Overall, these observations demonstrate that the statistical assurance provided by the two-sided 50/95 UDU test remains consistent, regardless of the lot mean, and is more stringent than the USP <905> test.
- 1Bergum, J., and H. Li. "Acceptance Limits for the New ICH USP 29 Content-Uniformity Test," PharmTech 31, issue 10 (December 2007).
- 2US Food and Drug Administration. "Questions and Answers on Current Good Manufacturing Practices, Good Guidance Practices—Production and Process Controls." (August 2013). http://www.fda.gov/Drugs/GuidanceComplianceRegulatoryInformation/Guidances/ucm124782.htm
- 3US Pharmacopeia National Formulary 2017. USP 40<en dash>NF 35.
- 4US Food and Drug Administration. Guidance for Industry. "Process Validation: General Principles and Practices." (January 2011). https://www.fda.gov/downloads/drugs/guidances/ucm070336.pdf
- 5 a b c d e Bergum, J., "Tolerance Interval Alternative to ASTM E2709/E2810 Methodology: Providing Assurance of Passing the USP UDU Test <905>." Pharmaceutical Engineering 35, no. 6 (November-December 2015): 68–79.
- 6 a b Bergum, J., et al. "Assessment of Blend and Content Uniformity. Technical Discussion of Sampling Plans and Application of ASTM E2709/E2810." Journal of Pharmaceutical Innovation 10, issue 1 (March 2015): 84–97.
- 7ASTM International. Standard ASTM E2810-11. "Standard Practice for Demonstrating Capability to Comply with the Test for Uniformity of Dosage Units." (2011) http://www.astm.org/cgi-bin/resolver.cgi?E2810-11e2
- 8US Pharmacopeial Convention. "<905> Uniformity of Dosage Units." December 2011. http://www.usp.org/usp-nf/harmonization/stage-6/uniformity-dosage-units
- 9Guenther, W. C. Sampling Inspection in Statistical Quality Control. New York: Oxford University Press, 1977.
- 10Garcia, T., et al., "Recommendations for the Assessment of Blend and Content Uniformity:Modifications to Withdrawn FDA Draft Stratified Sampling Guidance." Journal of Pharmaceutical Innovation 10, issue 1 (March 2015): 76–83.
- 11Shen, M., and Y. Tsong. "Bias of the USP Harmonized Test for Dose Content Uniformity. Stimuli to the Revision Process." Pharmacopeial Forum 37 (January 2011).
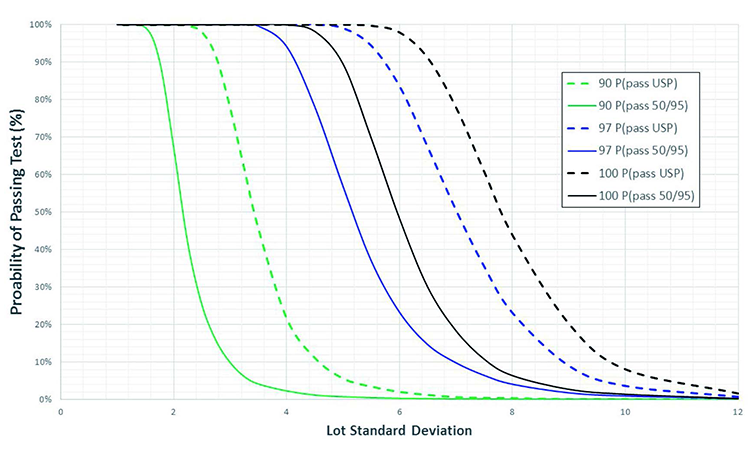
Another comparison of USP <905> UDU vs. the two-sided 50/95 UDU approach is shown in Figure 2, which depicts OC curves demonstrating probability to pass the unit dose test as a function of SD for three different lot means (90, 97, and 100 %LC). A quick comparison of these curves reveals that for each lot mean, the corresponding curve is significantly right-shifted for the two-sided 50/95 UDU test vs. the USP <905> UDU test, demonstrating again the relatively conservative nature of this test as
compared to USP <905>.
More quantitative comparisons of the two tests are depicted in Figure 3 and Figure 4. Figure 3 provides a graphical depiction of the confidence provided by USP <905> that future samples will pass the USP <905> UDU test as a function of the tested lot mean, when probability to pass is held constant at 95% (corresponding to 98.58% coverage) and the tested sample passes at the acceptance limit (i.e. AV = 15). Figure 4 provides a graphical depiction of the probability provided by USP <905> that future samples will pass the USP <905> UDU test as a function of the tested lot mean, when confidence is held constant at 50% (γ = 0.5) and the tested sample passes at the acceptance limit (i.e. AV = 15).
Multiple statistical approaches have been proposed as replacements for the procedures and acceptance criteria currently defined by usp <905>.
First, the maximum allowable SDs acceptable per USP <905> were calculated for the various tested lot means. These values (tested lot mean and corresponding allowable SD) were then used in the two-sided acceptance value calculation (AV = | 100 - | + k × SD), and the equation was solved for k. Then, using the new values for k and Equation (3), the corresponding confidence (γ) was solved for a coverage (p) of 0.9858 (corresponding to 95% probability to pass USP <905>).5
The result for each lot mean was then
plotted (Figure 3) against the 50% confidence and 95% probability to pass USP <905> assured by the two-sided 50/95 UDU test.
To compare the probability provided by passing the two tests, the k values determined above were used to solve for coverage (p, corresponding to the probability to pass USP <905>) with confidence fixed to 50% (γ = 0.5). Each calculated coverage (p) was then converted to a probability to pass USP <905> using an OC curve generated for the corresponding tested lot mean (similar to the OC curves depicted in Figure 1). The result for each lot mean was then plotted (Figure 4) against the 50% confidence and 95% probability to pass USP <905> assured by the two-sided 50/95 UDU test.
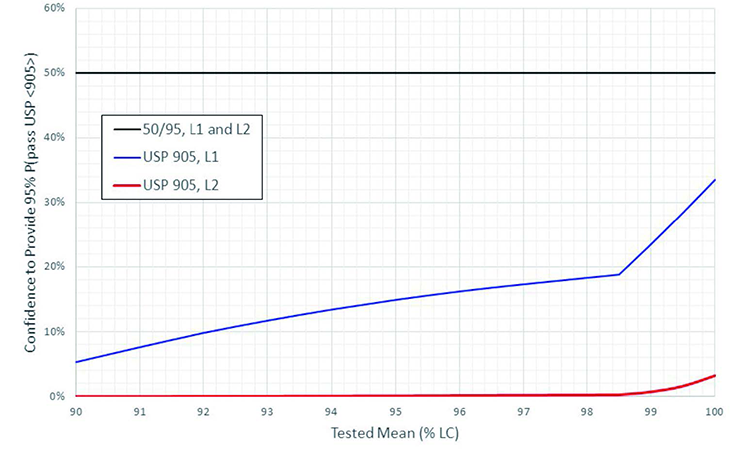
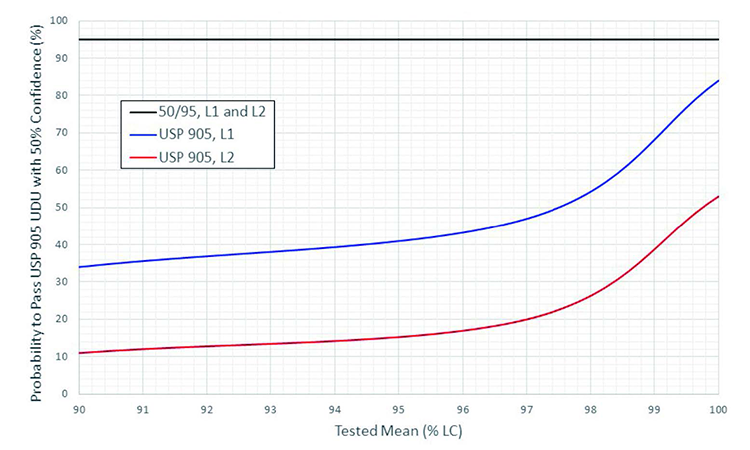
As depicted in Figure 3 and Figure 4, when the acceptance criteria are met, the two-sided 50/95 UDU test consistently provides at least 50% confidence and 95% probability to pass USP <905>, regardless of the tested lot mean. The USP <905> UDU test, on the other hand, provides variable statistical assurance that future samples will pass the test, with minimal confidence and coverage assurances changing significantly as a function of the lot mean.
In addition to the variable statistical assurance provided by the USP <905> UDU test, a cursory glance at Figure 3 and Figure 4 also demonstrates the superior statistical assurance provided by the two-sided 50/95 UDU test at all acceptable lot mean values. In fact, a careful review of these comparisons suggests that the two-sided 50/95 UDU test is, if anything, more conservative than what is required to ensure CPV. That is beyond the scope of this manuscript, however, and a likely topic of future debate.
SUMMARY
A two-sided tolerance interval test has been developed and proposed to satisfy CU release criteria for batches of pharmaceutical drug product manufactured in unit doses. The two-sided 50/95 UDU provides consistent statistical assurance that if samples taken during manufacturing meet the proposed acceptance criteria (AV50/95 ≤ 15), then with 50% confidence there is at least 95% probability that samples from the batch would pass the USP <905> UDU test. To ensure this level of statistical assurance, the test is significantly more stringent than the traditional USP <905> UDU. In addition, implementation of the methodology has a very similar look and feel to that of the current USP <905>, increasing the likelihood that it will be accepted by the pharmaceutical industry.
Acknowledgments
The authors would like to acknowledge James Bergum, President of BergumSTATS, for his prolific publication on topics related to CU and for his generous contribution of time to entertain multiple discussions on the various statistical options that exist for overcoming the limitations of the
current USP <905> test.
The authors would also like to acknowledge Walid Habib, PhD, Senior Director of Pharmaceutical Development, and Terry Streng, Senior Director of Technical Services, both at Upsher-Smith Laboratories, for their support of this work.